

Overview
The Desktop App settings in the HRMS Portal let administrators control who can use the desktop app and which monitoring features run on them. From a single area under Portal Settings, administrators can download the application for each supported platform, decide which employees are authorized to sign in, and configure features such as idle time detection, camera verification, automatic screenshots and others.
The Desktop App Settings page is organized into the following sub-pages, listed in the left-hand menu:
- Desktop Application Access: Controls who may log in to the desktop client and provides download links for the desktop and mobile applications. The applications can also be downloaded from My Profile.
- Idle Time Detection & Prompting: Detects keyboard and mouse inactivity so users can be shown as idle or inactive in Live Monitoring, and prompts users to log unrecorded time on resuming activity. This feature is enabled by default.
- Camera Access Settings: Controls webcam verification and snapshot capture on the desktop. This feature is disabled by default and can be enabled only after confirmation . Camera images are displayed along with captured screenshots.
- Auto Screenshot Capture: Automatically takes desktop screen snapshots during active shift tracking. This feature is enabled by default. If this feature is disabled, camera captured images will not be displayed as well
- IP Address Collection: Logs IP addresses and network details for clock-in security and geofencing. This feature is enabled by default.
- Geo-Location Tracking: Captures geographic location coordinates at check in and check out. This feature is disabled by default and can be enabled after confirmation.
- System Running Processes Monitoring: Monitors active applications, background processes, and window titles for productivity auditing. The data is shown with the screenshots. This feature is enabled by default.
- Auto System Inventory Collection: Automatically indexes Computer domain, Computer name, and disk storage. This feature is enabled by default.
- Active Window Title Capture: Records the title of the active application window alongside tracked activity, for context on what was being worked on. This feature is enabled by default.
- Browser URL Capture Detail: Shows full URLs for opened tab in the browser for websites visited during tracking. This feature is enabled by default.
This guide covers:
- How to access the Desktop App settings from Portal Settings.
- How to choose who can use the desktop application and how to download the desktop and mobile apps.
- How to configure Idle Time Detection.
- How to enable Camera Access, including the compliance confirmation, and select its scope.
- How to configure Auto Screenshot Capture, including the capture interval and jitter window.
- How to view captured screenshots and camera images from Attendance and from Productivity Insights.
- Where the data collected by each setting is displayed.
- How to configure IP Address Collection.
- How to enable Geo-Location Tracking, including the compliance confirmation, and select its scope.
- How to configure System Running Processes Monitoring, Auto System Inventory Collection, and Active Window Title Capture.
- How to configure Browser URL Capture Details.
⚠️ Important: Camera Access Settings and Geo-Location Tracking are disabled by default. Because they fall under the organization’s data privacy and compliance policy, the portal asks for explicit confirmation before either can be enabled. Ensure the affected employees have been informed in line with applicable local regulations before proceeding.
📜 Note: Access to Portal Settings and its actions is controlled by role permissions. Users must have access to Portal Settings to view or change the Desktop App configuration.
Prerequisites
Before configuring the Desktop App settings, ensure the following are in place:
- The user must be logged in with a role that has granted access to Desktop Settings in Portal Settings Permissions.
- To restrict a setting to specific departments, the departments must already be configured in the system and have users assigned to them.
- To restrict a setting to specific users, the employees must already exist as system users.
- Before enabling Camera Access or Geo-Location Tracking, the organization’s privacy and compliance requirements must be reviewed and employees informed as required.
- Devices must meet the minimum operating system requirements.
Section 1: Accessing Desktop App Settings
After logging in to the HRMS Portal, follow the steps below to open the Desktop App settings.
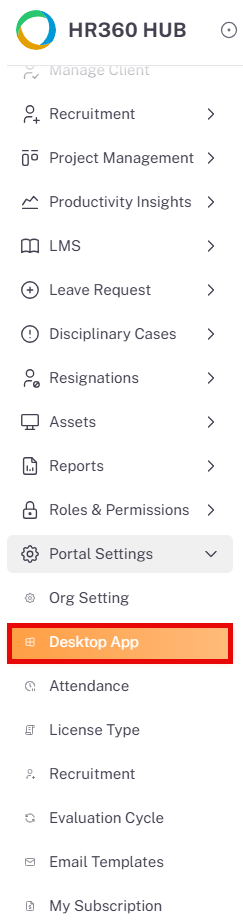
- From the left sidebar, scroll to Portal Settings and click it to expand the sub-menu.
- The sub-menu displays Org Setting, Desktop App, Attendance, License Type, Recruitment, Evaluation Cycle, Email Templates, and My Subscription.
- Click on Desktop App to open the Desktop App Settings page.
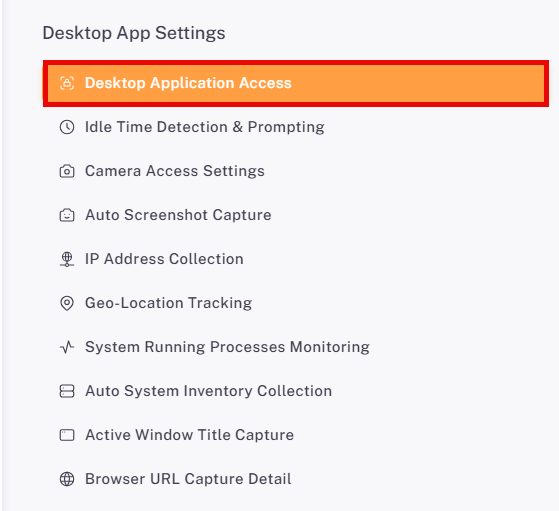
- The Desktop App Settings menu appears on the left, listing every sub-page. Desktop Application Access opens by default.
📜 Note: Once a user checks in, the Desktop App captures activity data, which is then synchronized and displayed within the Productivity Insights and Attendance modules on the web portal.
Section 2: Desktop Application Access
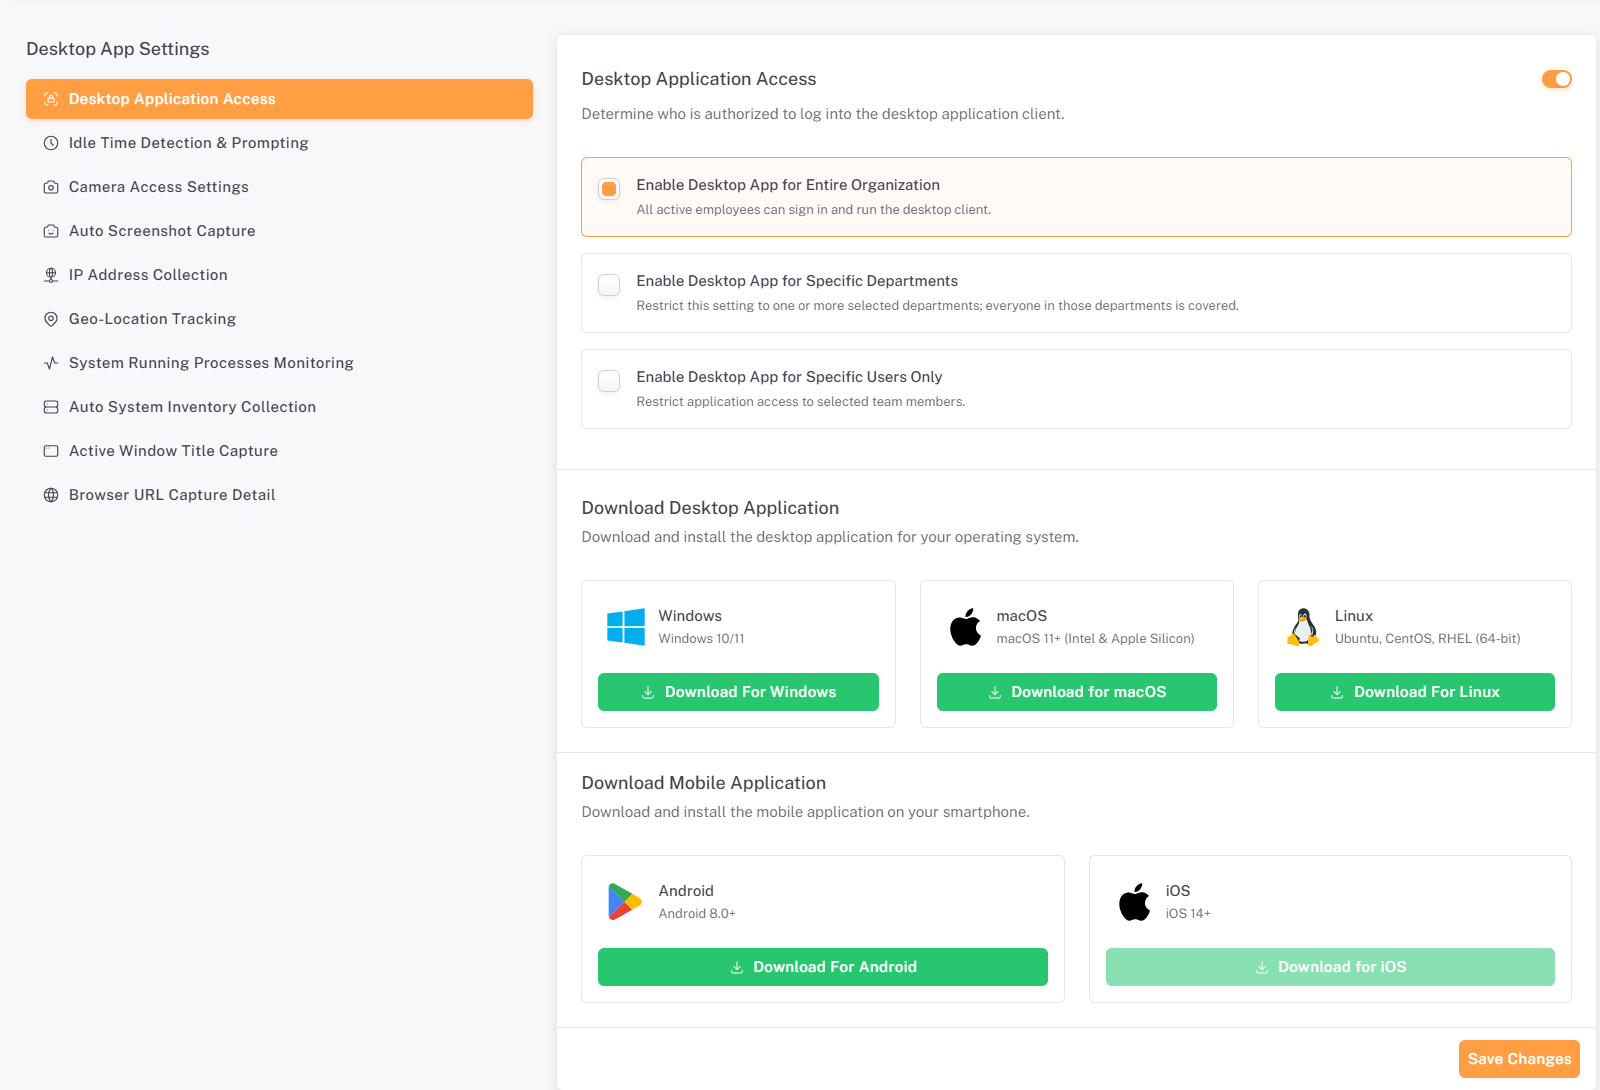
The Desktop Application Access page determines which employees are authorized to log in to the desktop application. It also provides download links for the desktop application on each supported operating system and for the mobile application.
📜 Note: Desktop App Access is enabled by default.
2.1. Enabling Desktop Application Access
The toggle in the top-right corner of the page turns Desktop Application Access on or off. When it is on, three access-scope options are displayed. Select the option that matches how the organization wants to roll out the desktop client.
Scope Option | Description | Additional Field |
Enable Desktop App for Entire Organization | All active employees can sign in and run the desktop client. | None |
Enable Desktop App for Specific Departments | Restricts the setting to one or more selected departments; everyone in those departments is covered. | Permitted Departments (required) |
Enable Desktop App for Specific Users Only | Restricts application access to selected team members. | Permitted Users (required) |
2.2. Entire Organization
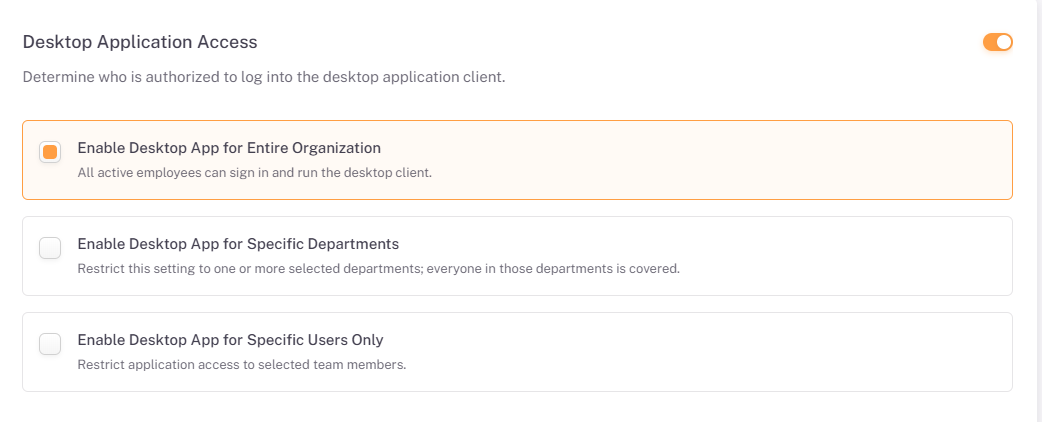
Select Enable Desktop App for Entire Organization to allow every active employee to sign in and run the desktop client. The selected option is highlighted with a colored border, and no further selection is needed.
2.3. Specific Departments
Select Enable Desktop App for Specific Departments to limit access to selected departments. A Permitted Departments field appears beneath the option. Multiple departments can be selected at a time.
- Select the Enable Desktop App for Specific Departments option.
- Click the Permitted Departments field and type or select one or more departments.
- Click Save Changes to apply the setting.
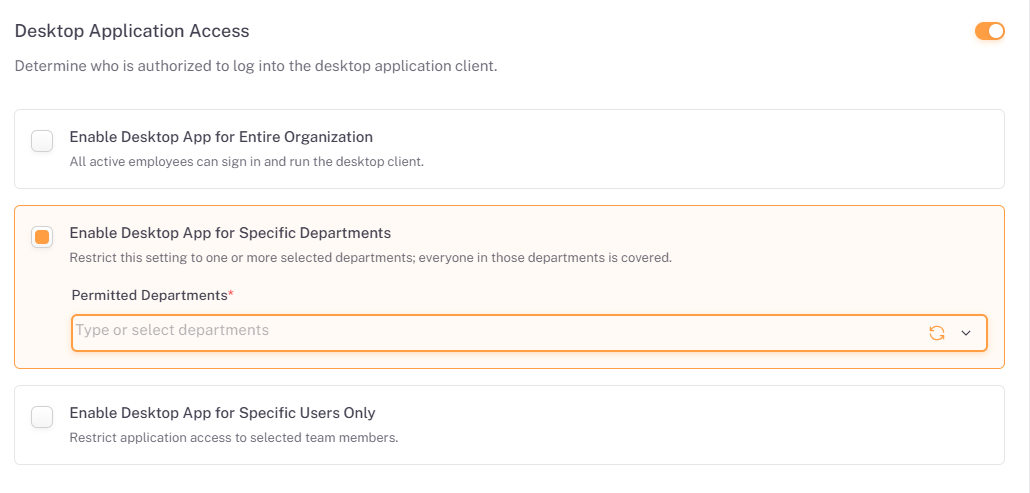
📜 Note: Permitted Departments is a required field (marked with a red asterisk) when desktop app is enabled for specific departments. Use the refresh icon beside the field to reload the list of available departments.
2.4. Specific Users Only
Select Enable Desktop App for Specific Users Only to limit access to individual team members. A Permitted Users field appears beneath the option. Multiple employees can be selected at a time.
- Select the Enable Desktop App for Specific Users Only option.
- Click the Permitted Users field and type or select one or more users.
- Click Save Changes to apply the setting.
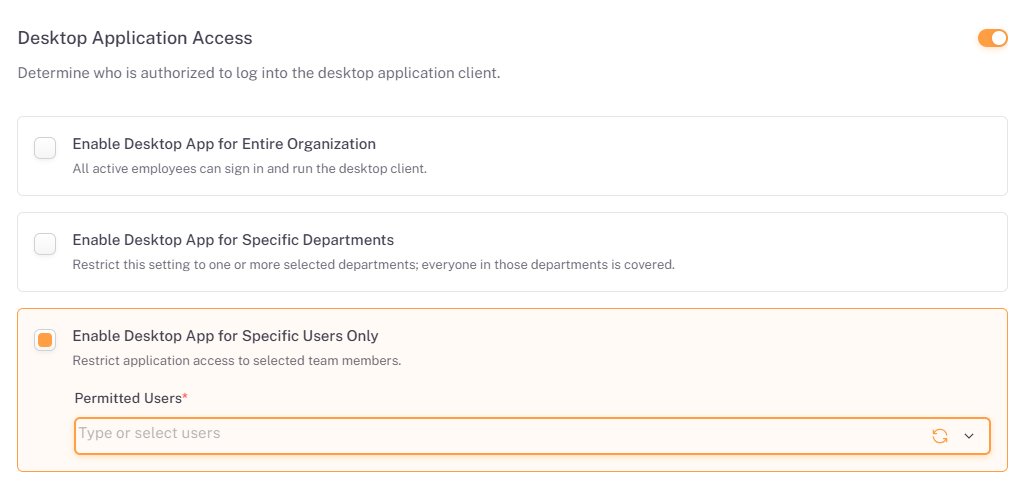
📜 Note: Permitted Users is a required field (marked with a red asterisk) when desktop app is enabled for specific employees. Use the refresh icon beside the field to reload the list of available users.
2.5. Downloading the Desktop and Mobile Applications
Below the access options, the page provides download buttons for the desktop and mobile applications. Click the button for the required platform to download the installer.
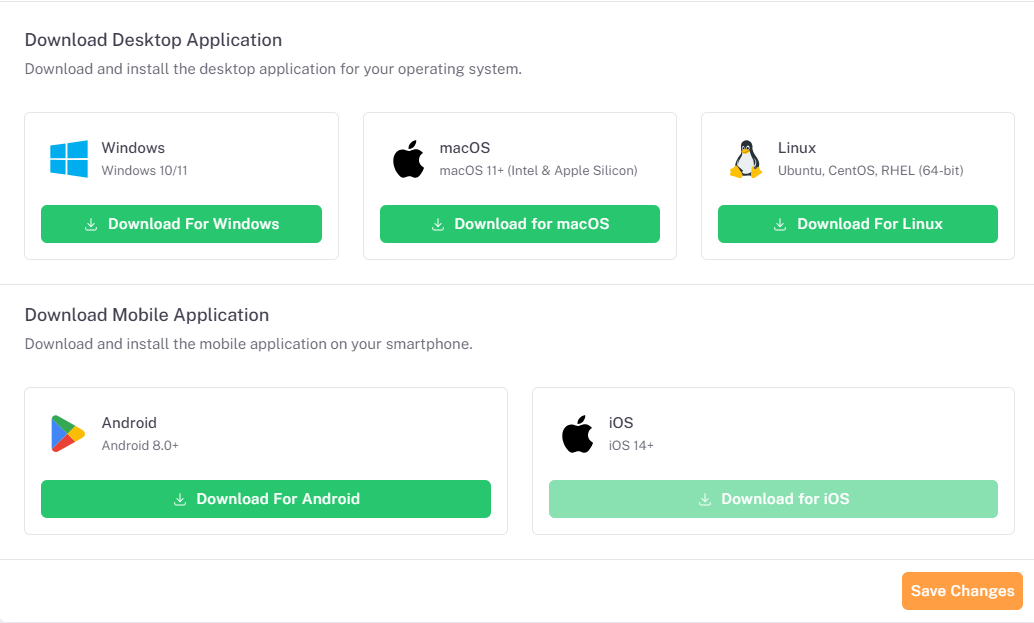
2.5.1 Download Desktop Application
Platform | Supported Versions | Button |
Windows | Windows 10/11 | Download For Windows |
macOS | macOS 11+ (Intel & Apple Silicon) | Download for macOS |
Linux | Ubuntu, CentOS, RHEL (64-bit) | Download For Linux |
2.5.2 Download Mobile Application
Platform | Supported Versions | Button |
Android | Android 8.0+ | Download For Android |
iOS | iOS 14+ | Download for iOS (currently unavailable) |
📜 Note: The Download for iOS button is displayed in a faded state and cannot be clicked. The iOS application is not currently available for download; the option is shown for future availability.
2.6. Saving Changes
Click Save Changes at the bottom-right of the page to apply the access scope. Changes are not applied until Save Changes is clicked.
2.7. Downloading from My Profile
In addition to the Desktop Application Access page, every user can download the desktop and mobile applications from the Download Apps tab in My Profile. This option is enabled by default and does not depend on the access scope configured in Section 2.1.
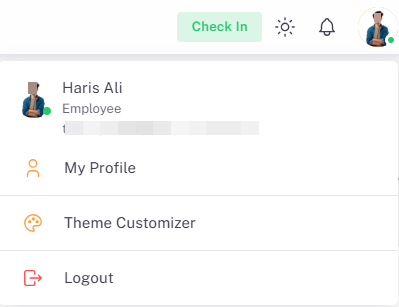
- Click the user avatar in the top-right corner of the portal. A drop-down menu opens showing the user’s name and role, along with My Profile, Theme Customizer, and Logout.
- Click My Profile to open the profile page.
- In the tab bar, click Download Apps. If the tab is not visible, use the arrows at either end of the tab bar to scroll.
- On the Application Downloads panel, click the download button for the required platform under Download Desktop Application or Download Mobile Application.
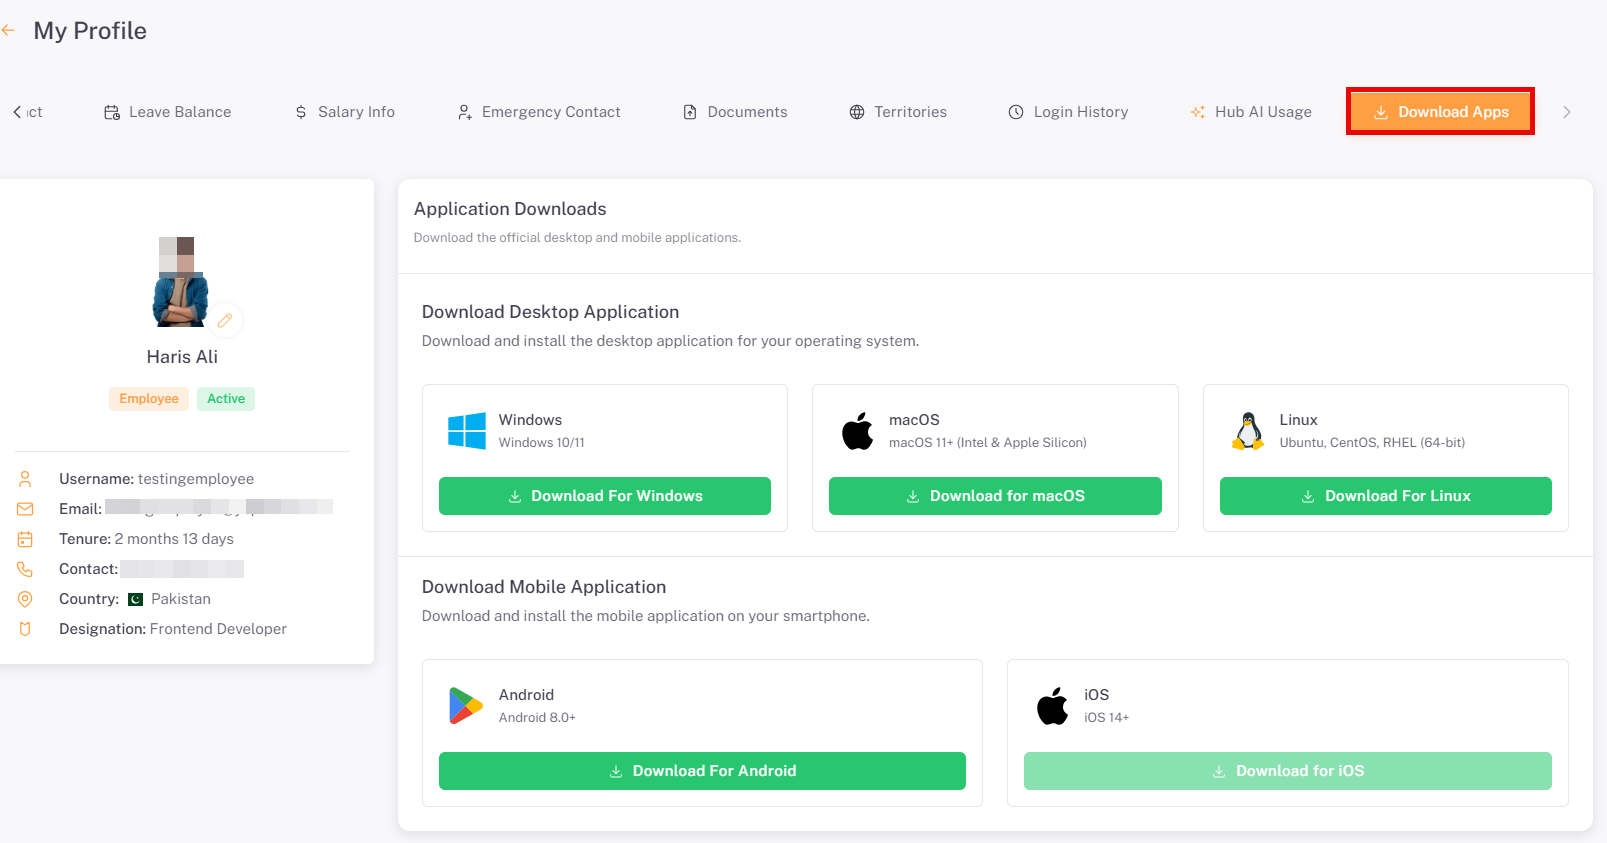
The Download Apps tab offers the same platforms and versions listed in Section 2.5.
📜 Note: There is no permission restriction on downloading desktop app from My Profile. Any user can download the desktop application, and the mobile application can be downloaded without any scope restrictions.
Section 3: Idle Time Detection & Prompting
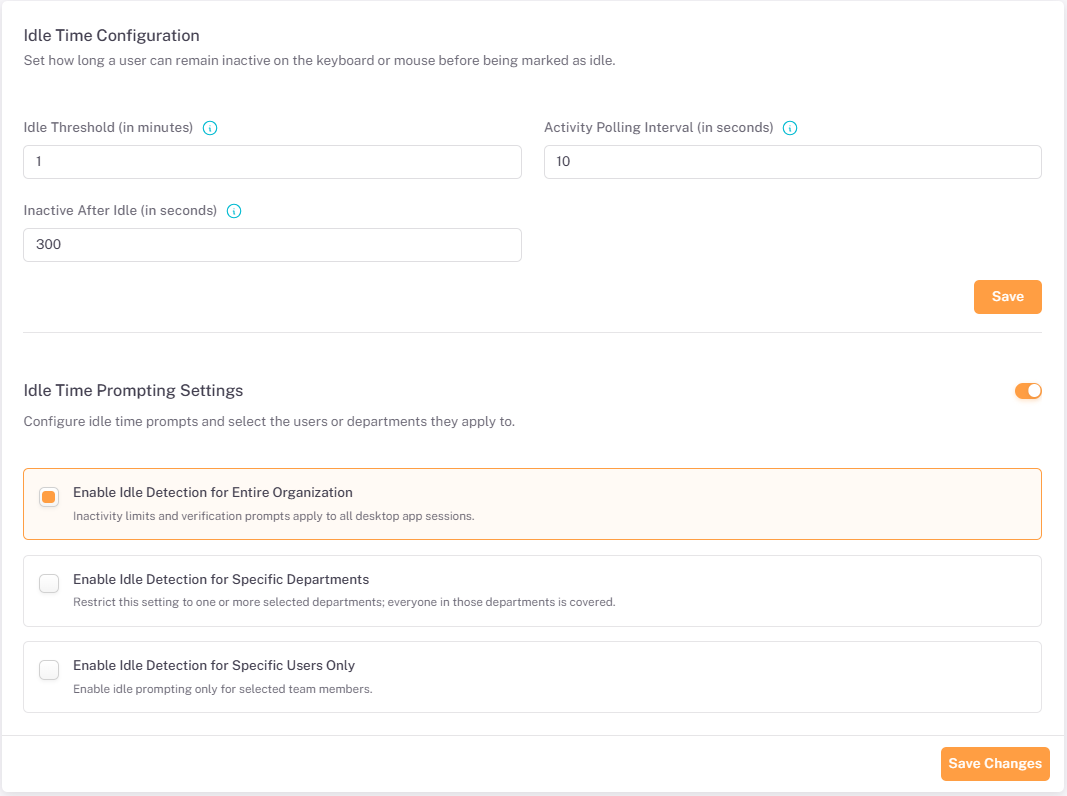
The Idle Time Detection & Prompting page has two parts: Idle Time Configuration, which sets how long a user can remain inactive on the keyboard or mouse before being marked as idle. and Idle Time Prompting Settings, which configures idle time prompts and selects the users or departments they apply to. To open it, click Idle Time Detection & Prompting in the Desktop App Settings menu.
📜 Note: Idle Time Detection & Prompting is enabled by default and can not be disabled using the toggle. Idle Time Prompting is turned on or off separately, using the toggle in the Idle Time Prompting Settings section
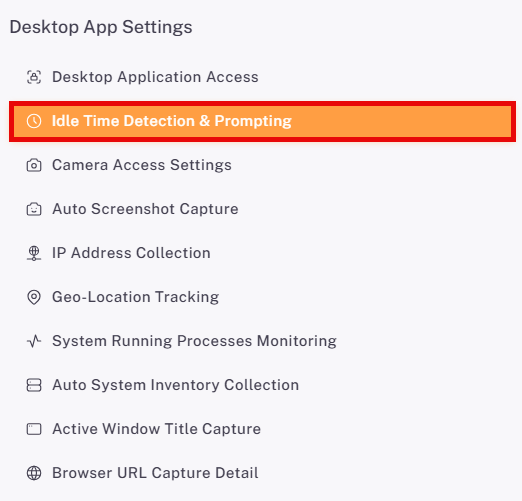
3.1. Idle Time Configuration
The Idle Time Configuration section sets how long a user can remain inactive on the key board or mouse before being marked as idle. Hover over the information icon next to each label for a description of the field. Click Save below the fields to apply the values; this Save button applies to the timing fields only.
Once the selected idle threshold passes with no keyboard or mouse activity, the user is shown as Idle in the Live Monitoring view of Productivity Insights. Similarly, if the user remains inactive after having been active, for the number of seconds set in Inactive After Idle, the user is marked as Inactive in Live Monitoring. The Activity Polling Interval controls how often the application repeatedly checks the user for activity.
Field | Description | Default Value |
Idle Threshold (in minutes) | The number of minutes without keyboard and mouse activity after which the user is shown as Idle in Live Monitoring. | 1 minute |
Activity Polling Interval (in seconds) | How often, in seconds, the desktop app repeatedly checks the user for keyboard and mouse activity. | 10 seconds |
Inactive After Idle (in seconds) | The number of seconds of inactivity after which a previously active user is marked as Inactive in Live Monitoring. | 300 seconds |
📜 Note: The default values can be edited to suit the organization’s requirements. The time at which a user’s status changes is not exact, as it can be a few seconds longer than the configured value.
3.2. Idle Time Prompting Settings
The Idle Time Prompting Settings section configures idle time prompts and selects the users or departments they apply to. Use the toggle in the top-right corner of the section to turn prompting on or off. When it is on, three scope options control who the idle prompting applies to:
- Enable Idle Detection for Entire Organization: Inactivity limits and verification prompts apply to all desktop app sessions.
- Enable Idle Detection for Specific Department: Restricts this setting to one or more selected departments; everyone in those departments is covered.
- Enable Idle Detection for Specific Users Only: Enable idle prompting only for selected team members.
📜 Note: The Idle Time Configuration and Idle Time Prompting Settings sections are saved separately. Click Save in the Idle Time Configuration section to apply the timing values, and click Save Changes at the bottom of the page to apply the prompting settings.
After selecting the scope, click Save Changes to apply the prompting configuration.
Section 4: Camera Access Settings
The Camera Access Settings page controls webcam verification and snapshot capturing on the desktop application. To open it, click Camera Access Settings in the Desktop App Settings menu.
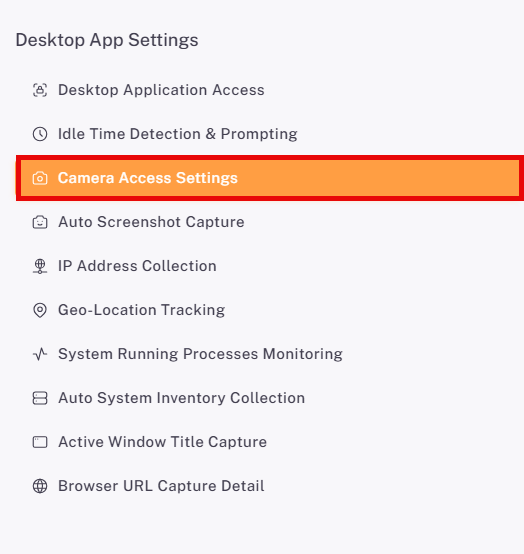
4.1. Default State
Camera Access is disabled by default. In this state the toggle is off, the three scope options are greyed out, and the Save Changes button is inactive.
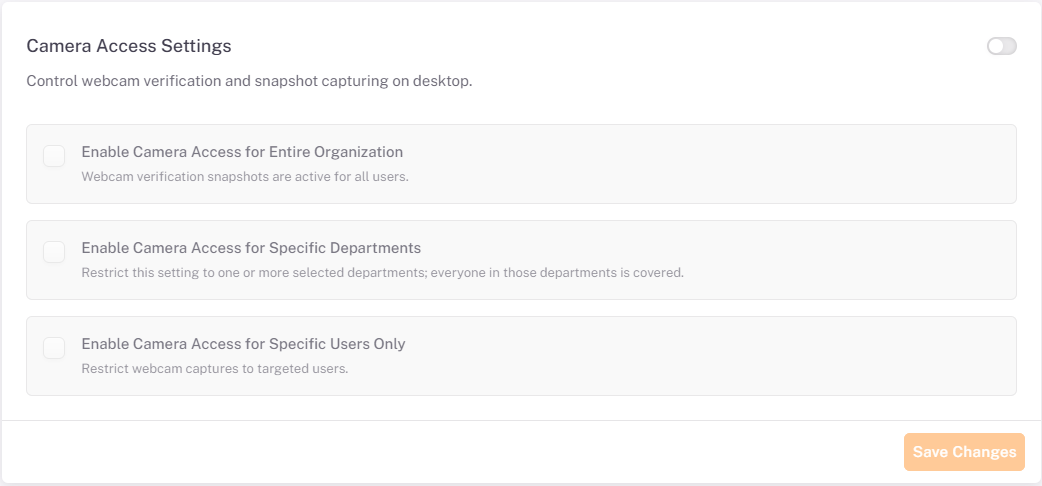
⚠️ Important: Camera Access is treated as a compliance-sensitive data category. It cannot be enabled until the compliance confirmation described in Section 4.2 has been accepted.
4.2. Enabling Camera Access
When the toggle is switched on, the Confirm Camera Access dialog appears before the setting is enabled.
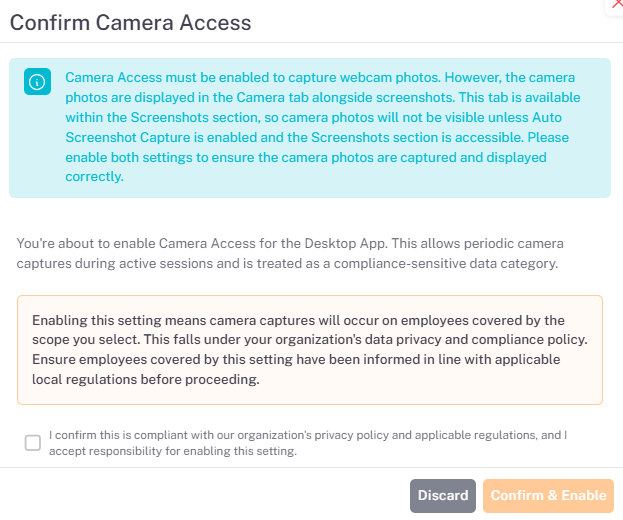
The dialog opens with an information note explaining that Camera Access must be enabled to capture webcam photos, but that the camera photos are displayed in the Camera tab alongside screenshots. Because this tab is within the Screenshots section, camera photos are not visible unless Auto Screenshot Capture is enabled and the Screenshots section is accessible, so both settings should be enabled.
The dialog also explains that enabling Camera Access allows periodic camera captures during active sessions, and that camera captures will occur on the employees covered by the scope you select. It reminds you that the setting falls under your organization’s data privacy and compliance policy, and that employees covered by it must be informed in line with applicable local regulations.
- Switch on the Camera Access Settings toggle. The Confirm Camera Access dialog opens.
- Read the compliance notice displayed in the dialog.
- Tick the checkbox confirming that enabling this setting is compliant with the organization’s privacy policy and applicable regulations, and that you accept responsibility for enabling it.
- Click Confirm & Enable to proceed, or click Discard to close the dialog without enabling Camera Access.
⚠️Important: Confirm & Enable stays inactive until the confirmation checkbox is ticked. By confirming, you accept responsibility for enabling this setting.
4.3. Selecting the Scope
Once Camera Access is enabled, the toggle turns on, the three scope options become active, and Save Changes is available. Select who the webcam verification applies to.
📜 Note: Camera images are displayed together with screenshots. Even when Camera Access is enabled, camera images are not shown unless Auto Screenshot Capture (Section 5) is also enabled. Each time a screenshot is captured, the camera also captures an image, which is displayed along with that screenshot.
Scope Option | Description | Additional Field |
Enable Camera Access for Entire Organization | Webcam verification snapshots are active for all users. | None |
Enable Camera Access for Specific Departments | Restricts the setting to one or more selected departments; everyone in those departments is covered. | Permitted Departments (required) |
Enable Camera Access for Specific Users Only | Restricts webcam captures to targeted users. | Permitted Users (required) |
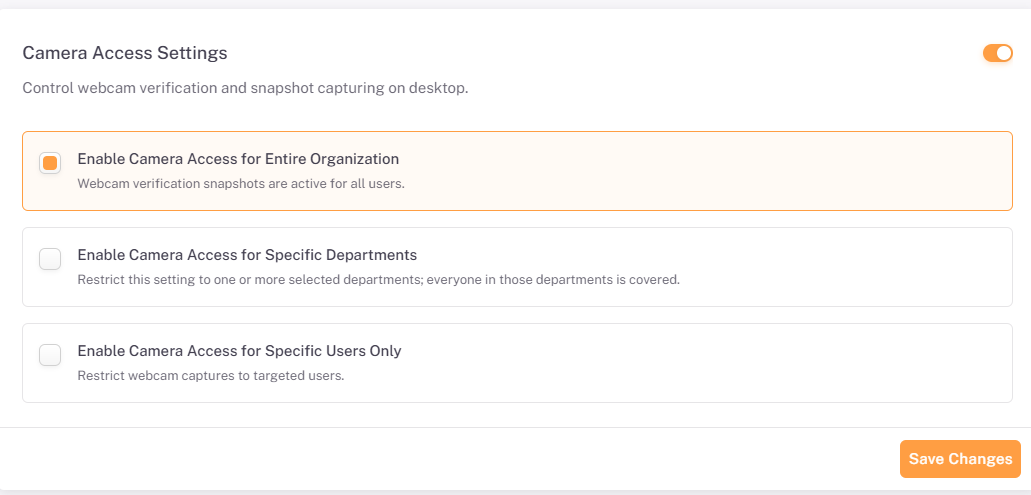
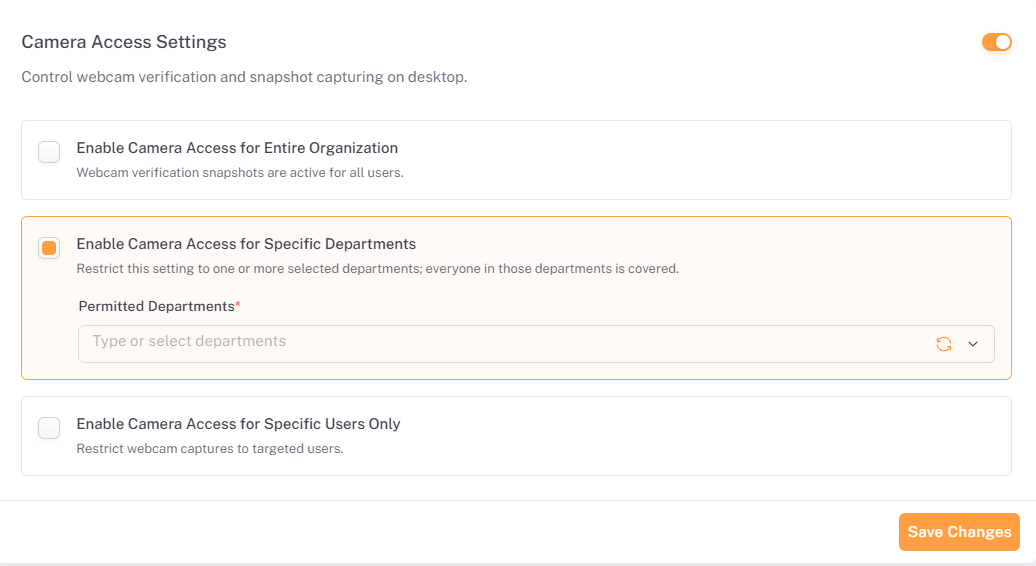
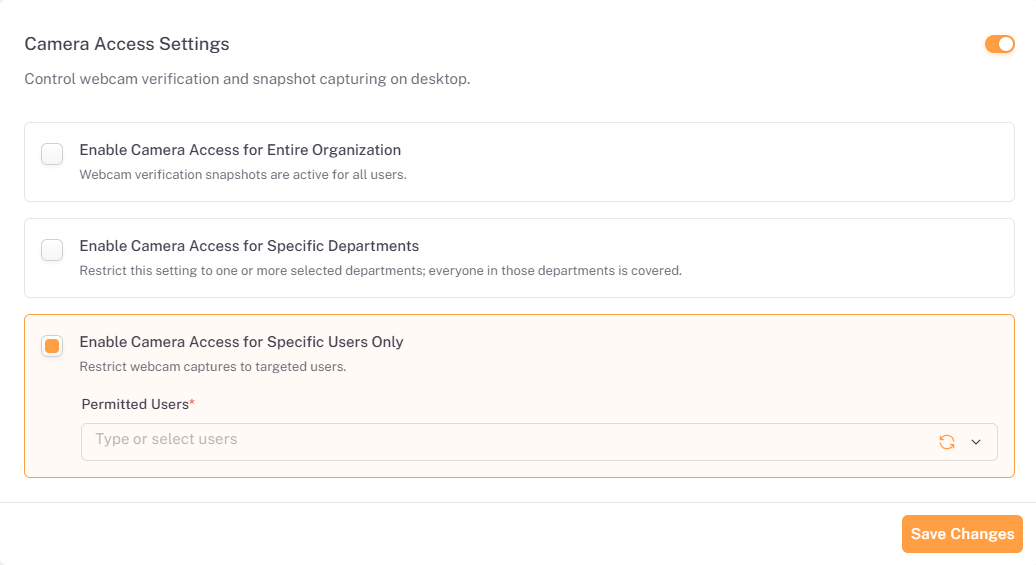
After choosing the scope (and selecting departments or users where applicable), click Save Changes to apply the setting.
📜 Note: Permitted Departments and Permitted Users are required fields. Use the refresh icon beside each field to reload the available options.
4.4. Viewing Camera Captures
Camera images are captured together with screenshots, so they are viewed in the screenshot viewer rather than on a separate page. The viewer is available from Attendance>Screenshots and from the employee’s screenshots in Productivity Insights →Daily Performance.
- Ensure that both Camera Access (this section) and Auto Screenshot Capture (Section 5) are enabled for the employee.
- Open Attendance → Screenshots, or Productivity Insights→ Daily Performance and click the eye icon for the employee.
- Open a screenshot to launch the screenshot viewer.
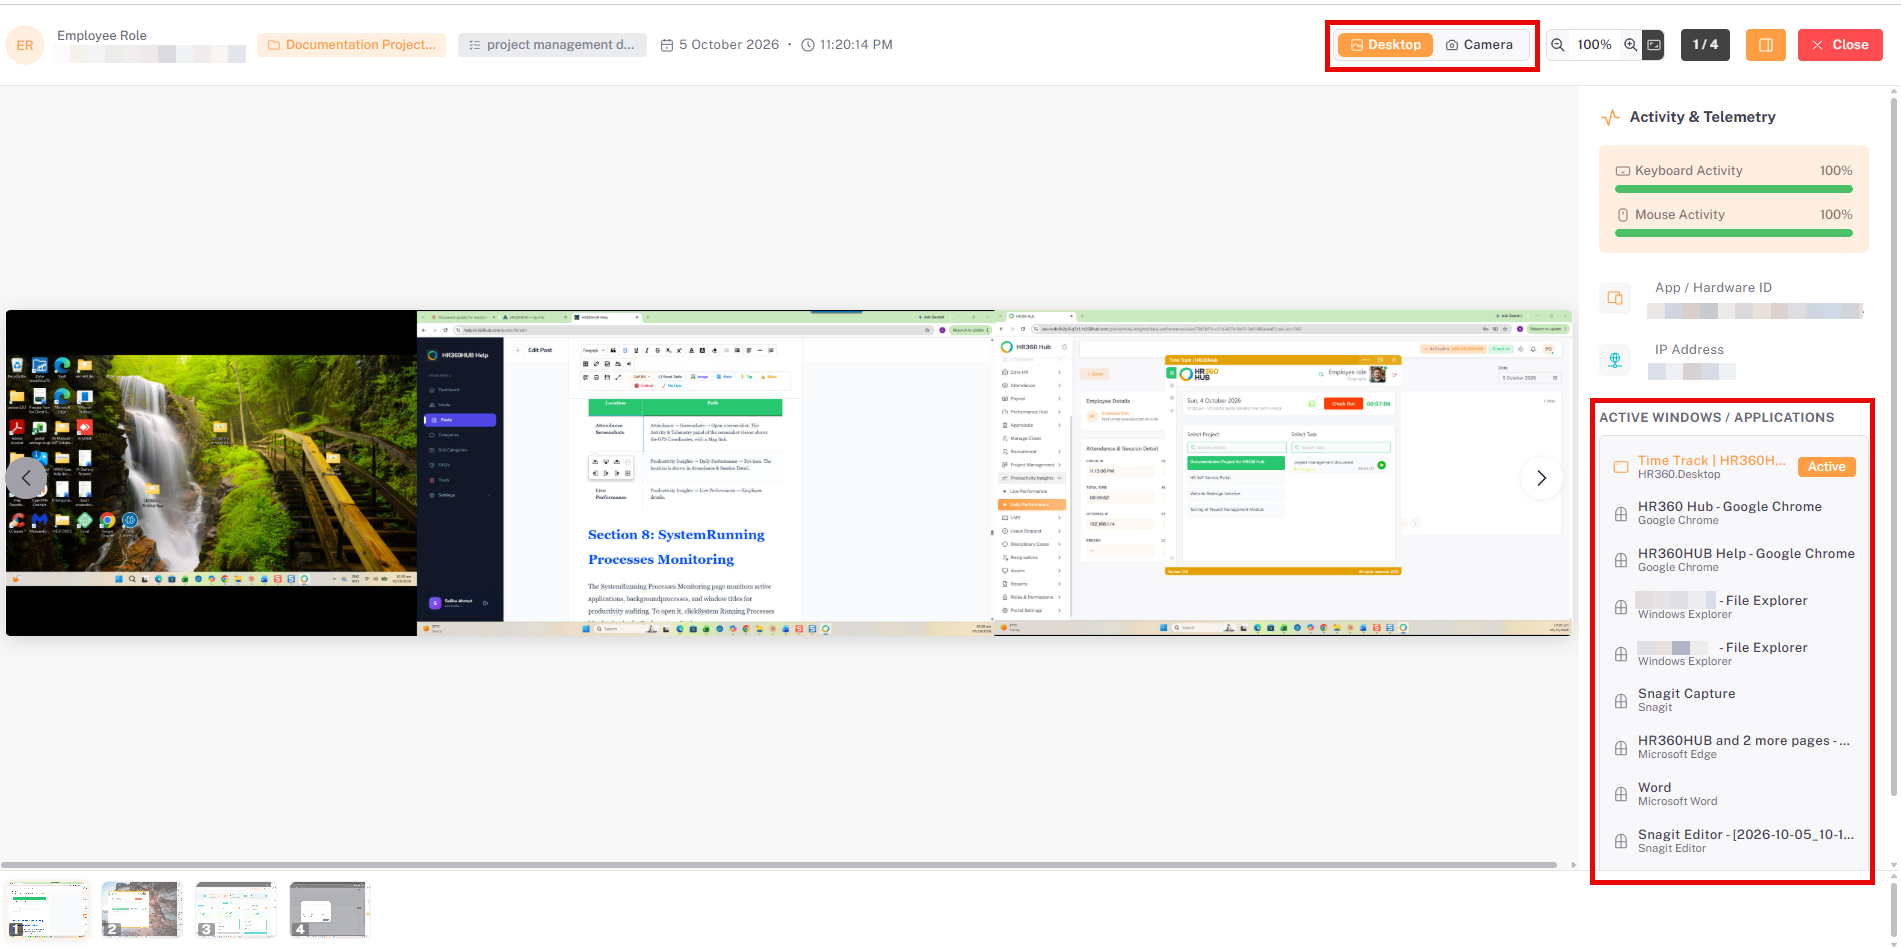
- At the top of the viewer, click Camera to see the camera image captured with that screenshot. Click Desktop to return to the screen capture.
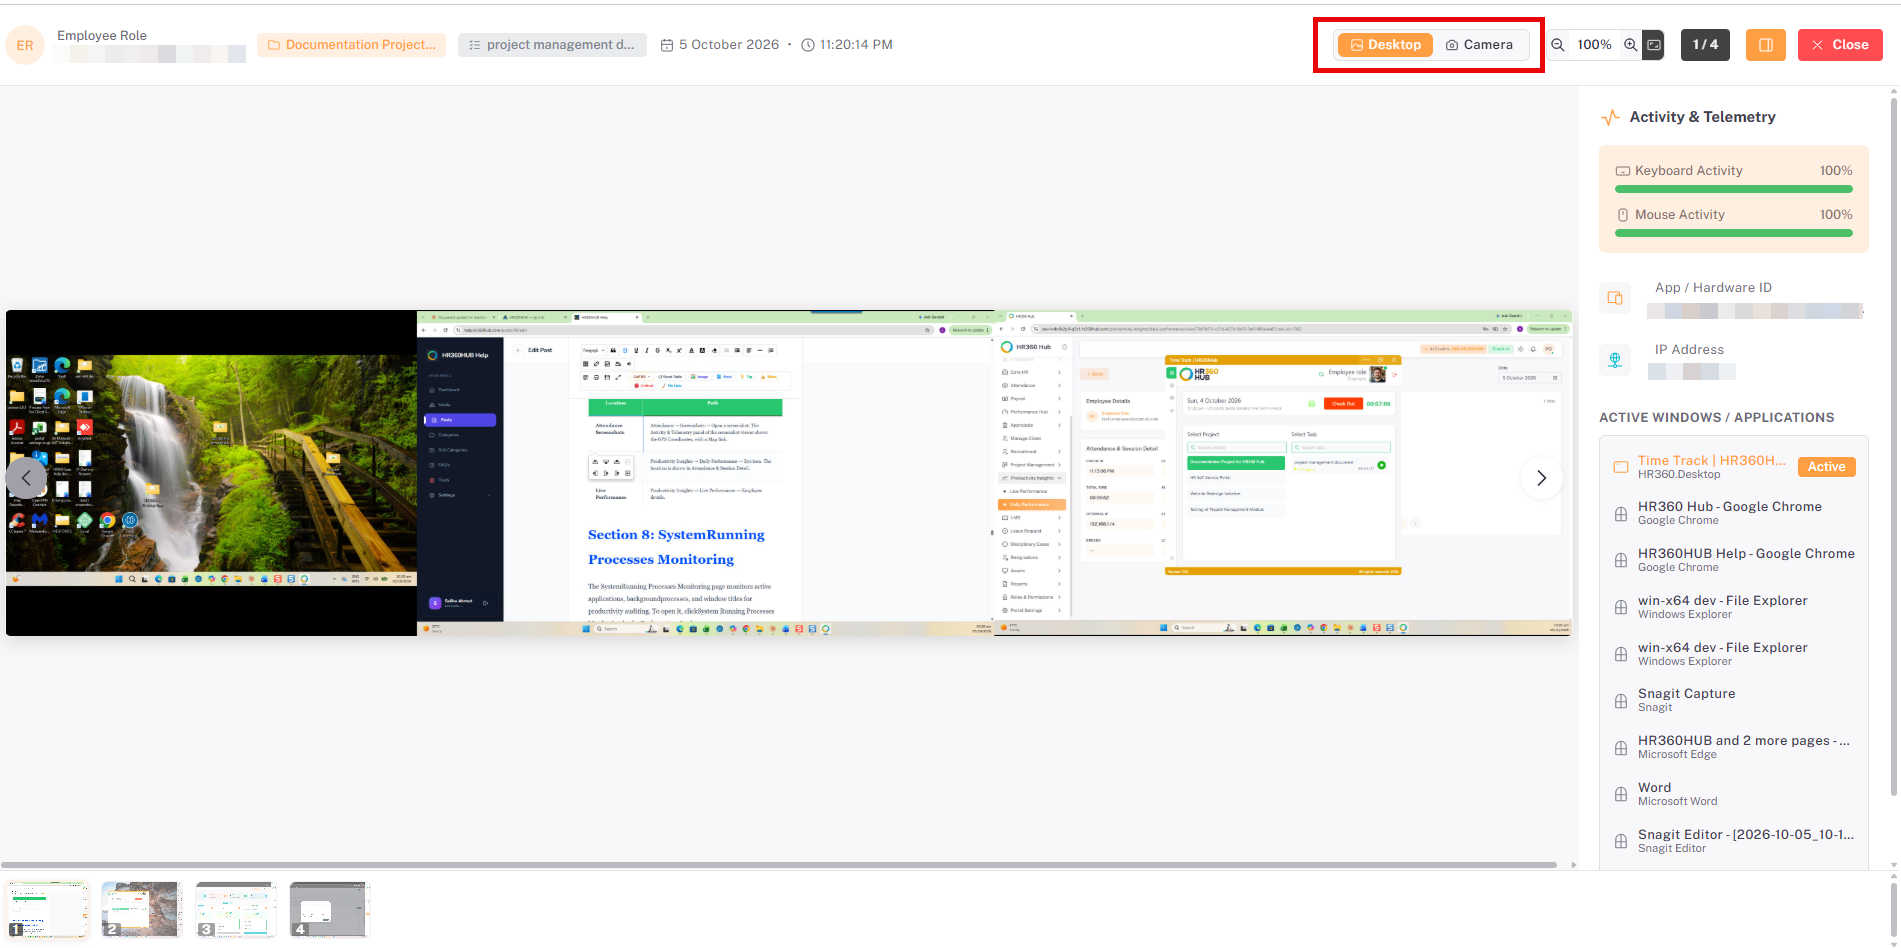
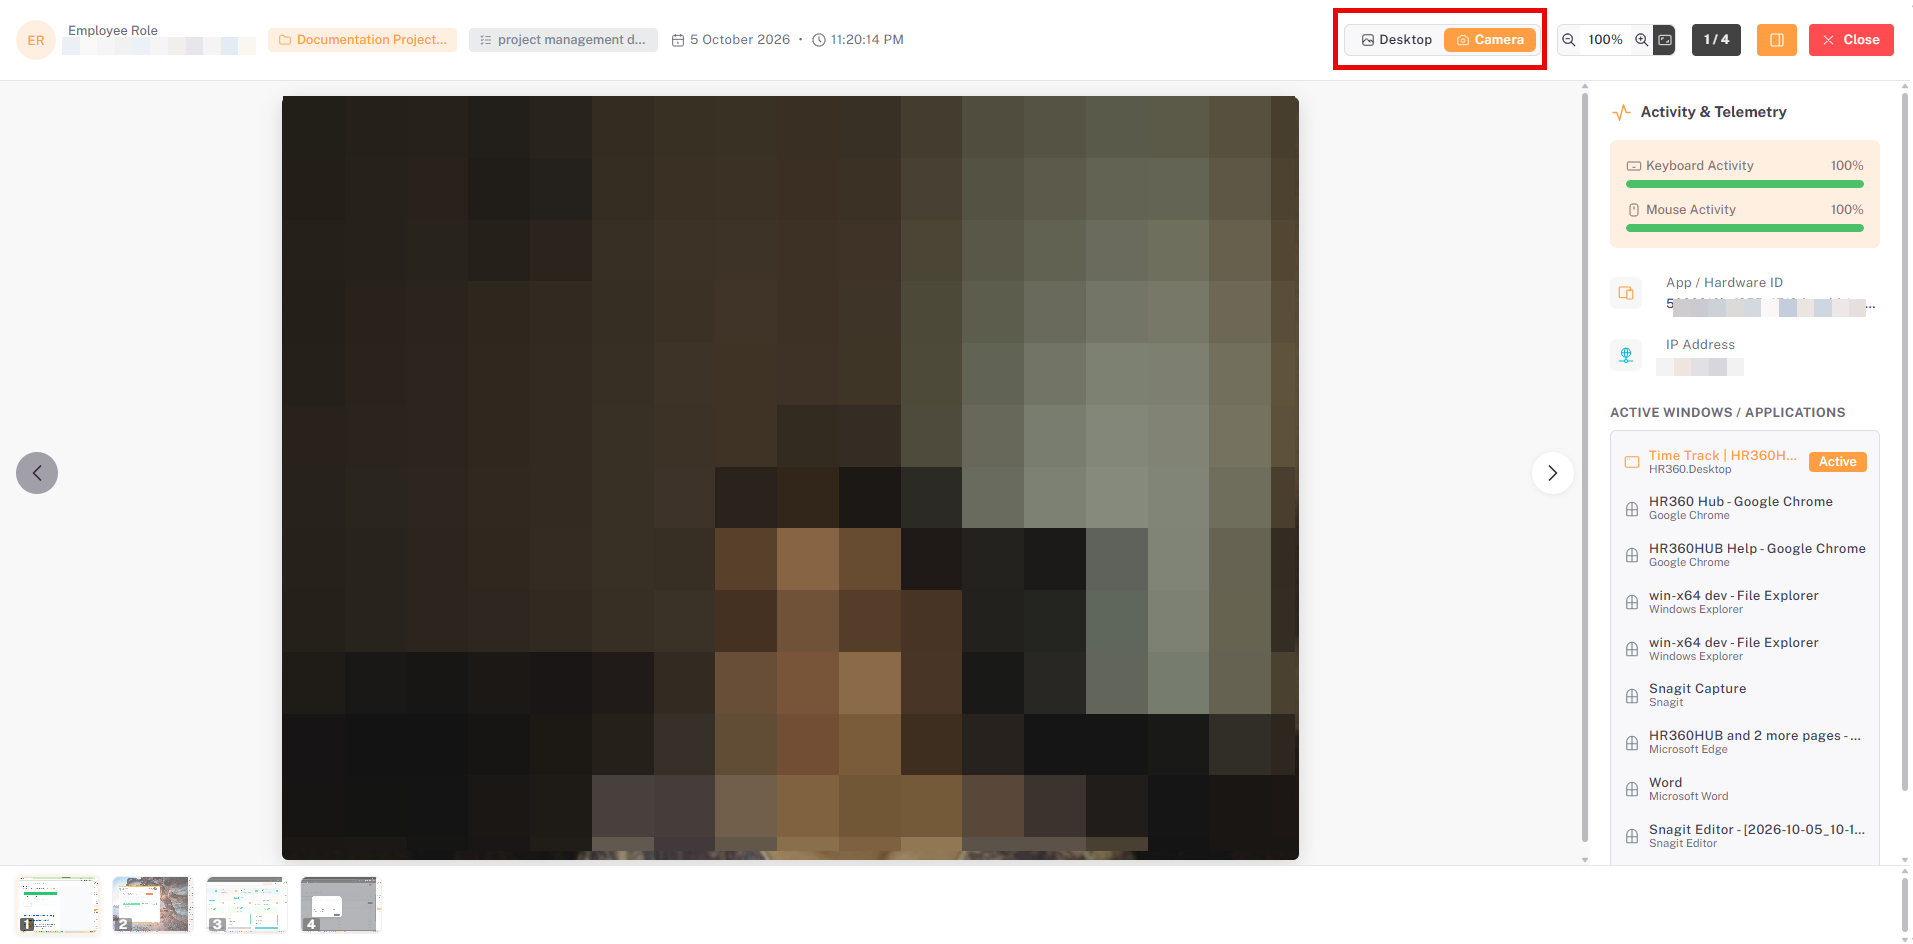
The viewer header shows the employee’s name and email, the project and task, and the date and time of the capture. It also provides the Desktop and Camera tabs, zoom controls, a counter showing the position of the current screenshot, and a Close button. Thumbnails along the bottom and the arrows at either side move between screenshots.
📜 Note: If Auto Screenshot Capture is not enabled, no screenshots are captured, so camera images are not displayed even when Camera Access is enabled.
Section 5: Auto Screenshot Capture
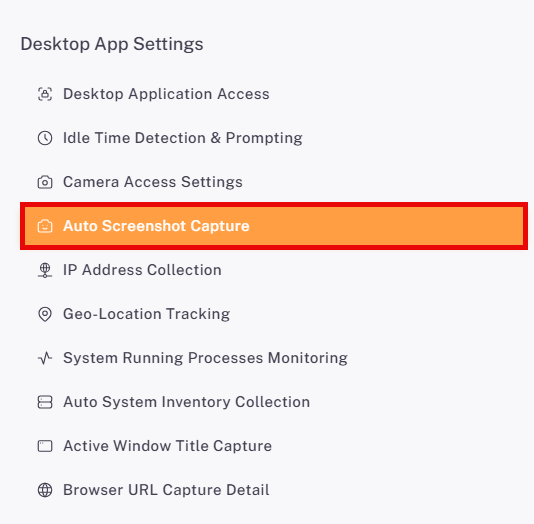
The Auto Screenshot Capture page automatically takes desktop screen snapshots during active shift tracking. To open it, click Auto Screenshot Capture in the Desktop App Settings menu.
📜 Note: Auto Screenshot Capture is enabled by default.
5.1. Capture Interval and Jitter Window
Use the toggle in the top-right corner to turn the feature on or off. When it is on, set how often screenshots are captured using the following fields. Hover over the information icon next to each label for a description of the field.
Field | Description |
Screenshot Capture Interval (in minutes) | The base time interval, in minutes, between automatic screenshot captures while a user’s shift is being tracked. A shorter interval produces more screenshots per shift; a longer interval produces fewer. |
Jitter Window (in seconds) | Allows the screenshot time to vary by up to the selected number of seconds before or after the interval, so that screenshots are not taken at exactly regular times. |
For example, with a 10-minute interval and a 60-second jitter window, the next screenshot is captured at a random point between 9 and 11 minutes.
📜 Note: The default values (10 minutes and 60 seconds) can be changed to suit the organization’s requirements.
5.2. Selecting the Scope
Below the timing fields, select who screenshots are captured for.
Scope Option | Description | Additional Field |
Enable Auto Screenshots for Entire Organization | Desktop screenshots are captured automatically for all active sessions. | None |
Enable Auto Screenshots for Specific Departments | Restricts the setting to one or more selected departments, everyone in those departments is covered. | Permitted Departments (required) |
Enable Auto Screenshots for Specific Users Only | Captures screenshots only for designated team members. | Permitted Users (required) |
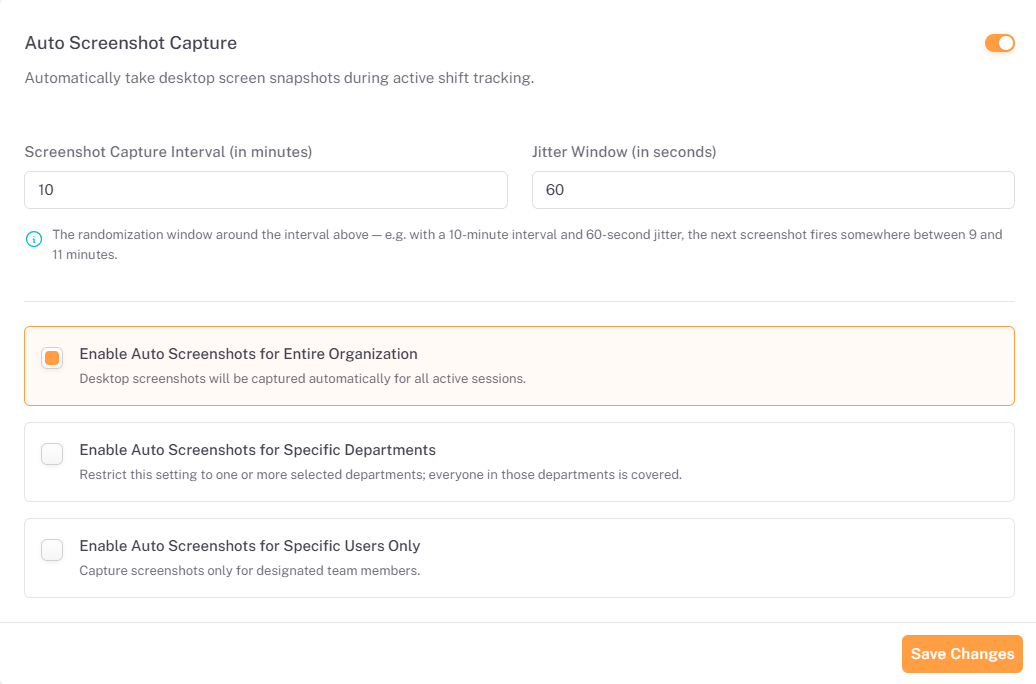
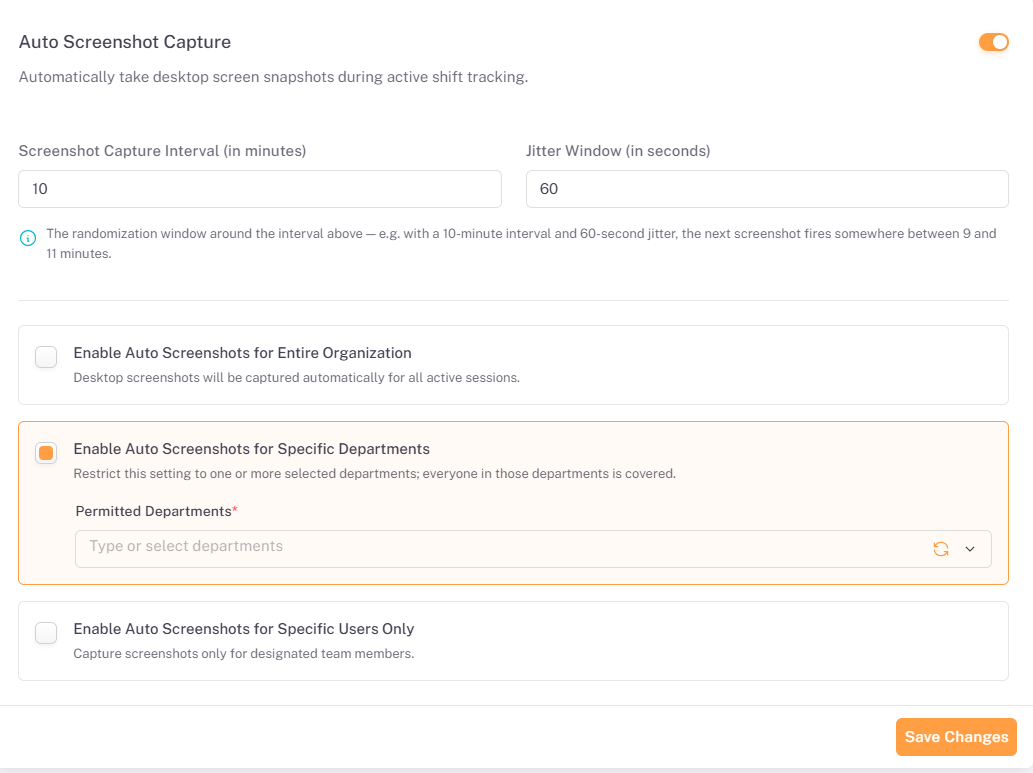
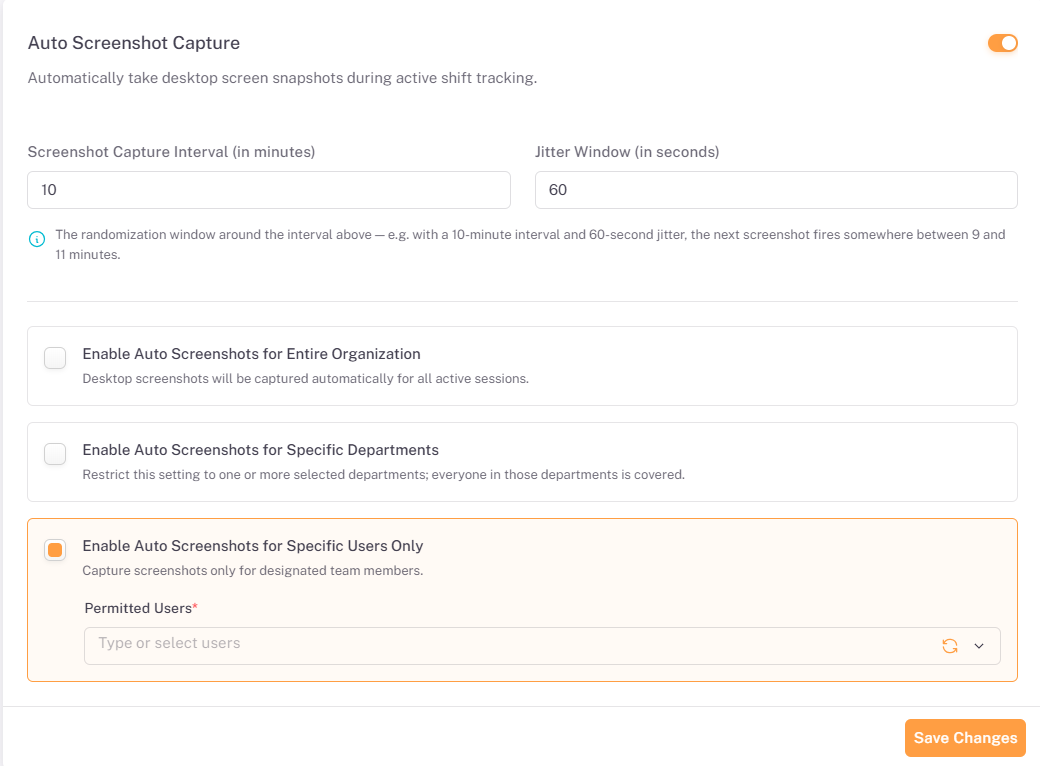
After setting the interval, jitter window, and scope, click Save Changes to apply the configuration.
💡 Tip: Use the jitter window to make capture times less predictable. A larger value spreads captures more widely around the configured interval.
5.3. Viewing Captured Screenshots in Attendance
Screenshots captured by the desktop application can be reviewed from the Screenshots page under Attendance. The page, titled Desktop Screenshots & Telemetry, lets administrators monitor employee activity tracking telemetry, screenshots, and application usage.
- From the left sidebar, click Attendance to expand the sub-menu.
- Click Screenshots to open the Desktop Screenshots & Telemetry page.
- Use the filters at the top of the page to narrow the results.
- Click View All beside an employee to see all of that employee’s screenshots.
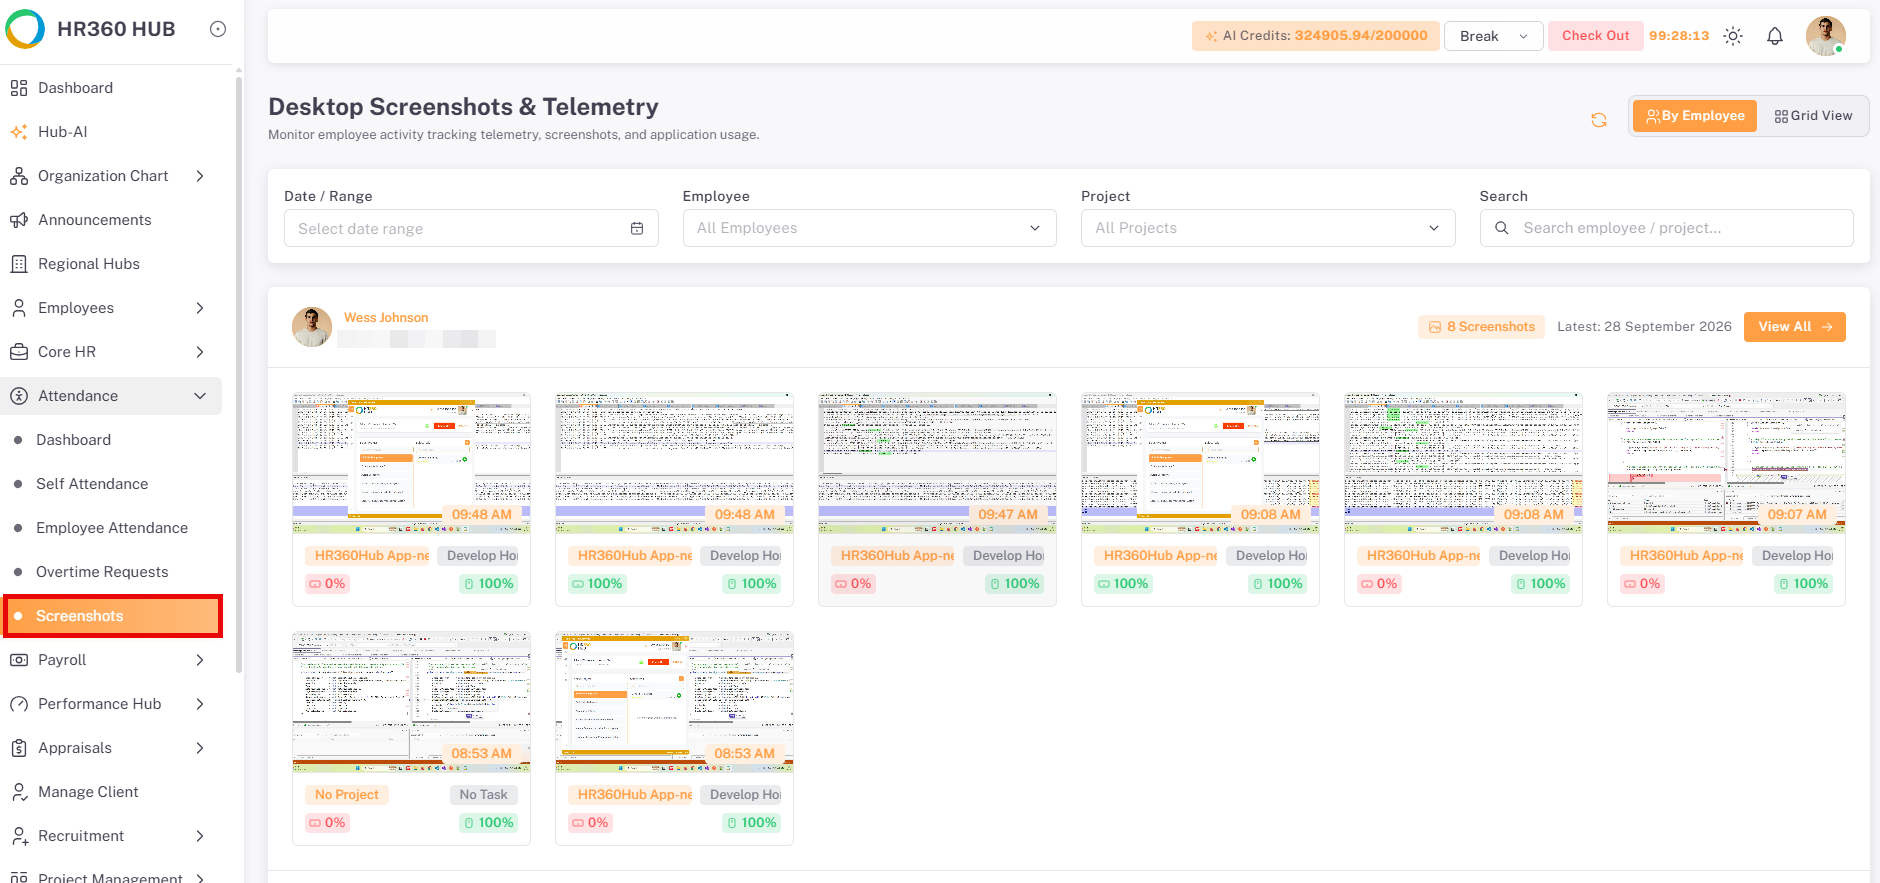
Control | Description |
Date / Range | Select a date or date range to filter the screenshots. |
Employee | Select a specific employee. The default is All Employees. |
Project | Select a specific project. The default is All Projects. |
Search | Search by employee or project name. |
Refresh icon | Reload the page to show the latest captured screenshots. |
By Employee / Grid View | Switch between grouping screenshots under each employee (By Employee) and a grid layout (Grid View). |
In the By Employee view, each employee has a card showing their name, the number of screenshots, and the date of the latest capture. Beneath it, each thumbnail shows the capture time, the project and task the user was working on, and two activity percentages.
📜 Note: Screenshots appear only for employees covered by the scope selected in Section 5.2. If Camera Access is also enabled (Section 4), the camera image captured at the same time is displayed along with the screenshot.
5.4. Viewing Screenshots from Productivity Insights
Screenshots can also be reviewed per employee and per day from Productivity Insights. Open the Daily Performance page and click the eye icon in the Actions column for the employee.
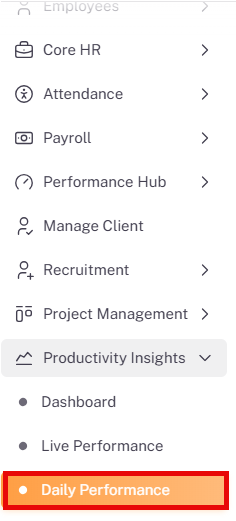
- From the left sidebar, click Productivity Insights to expand the sub-menu.
- Click Daily Performance.
- Locate the employee in the listing and click the eye icon in the Actions column.
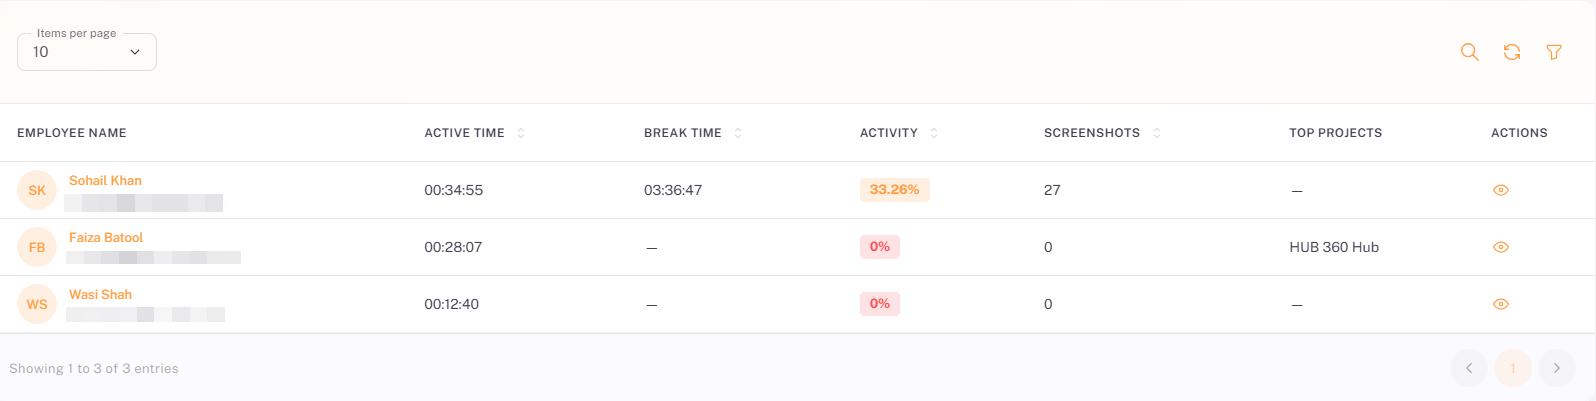
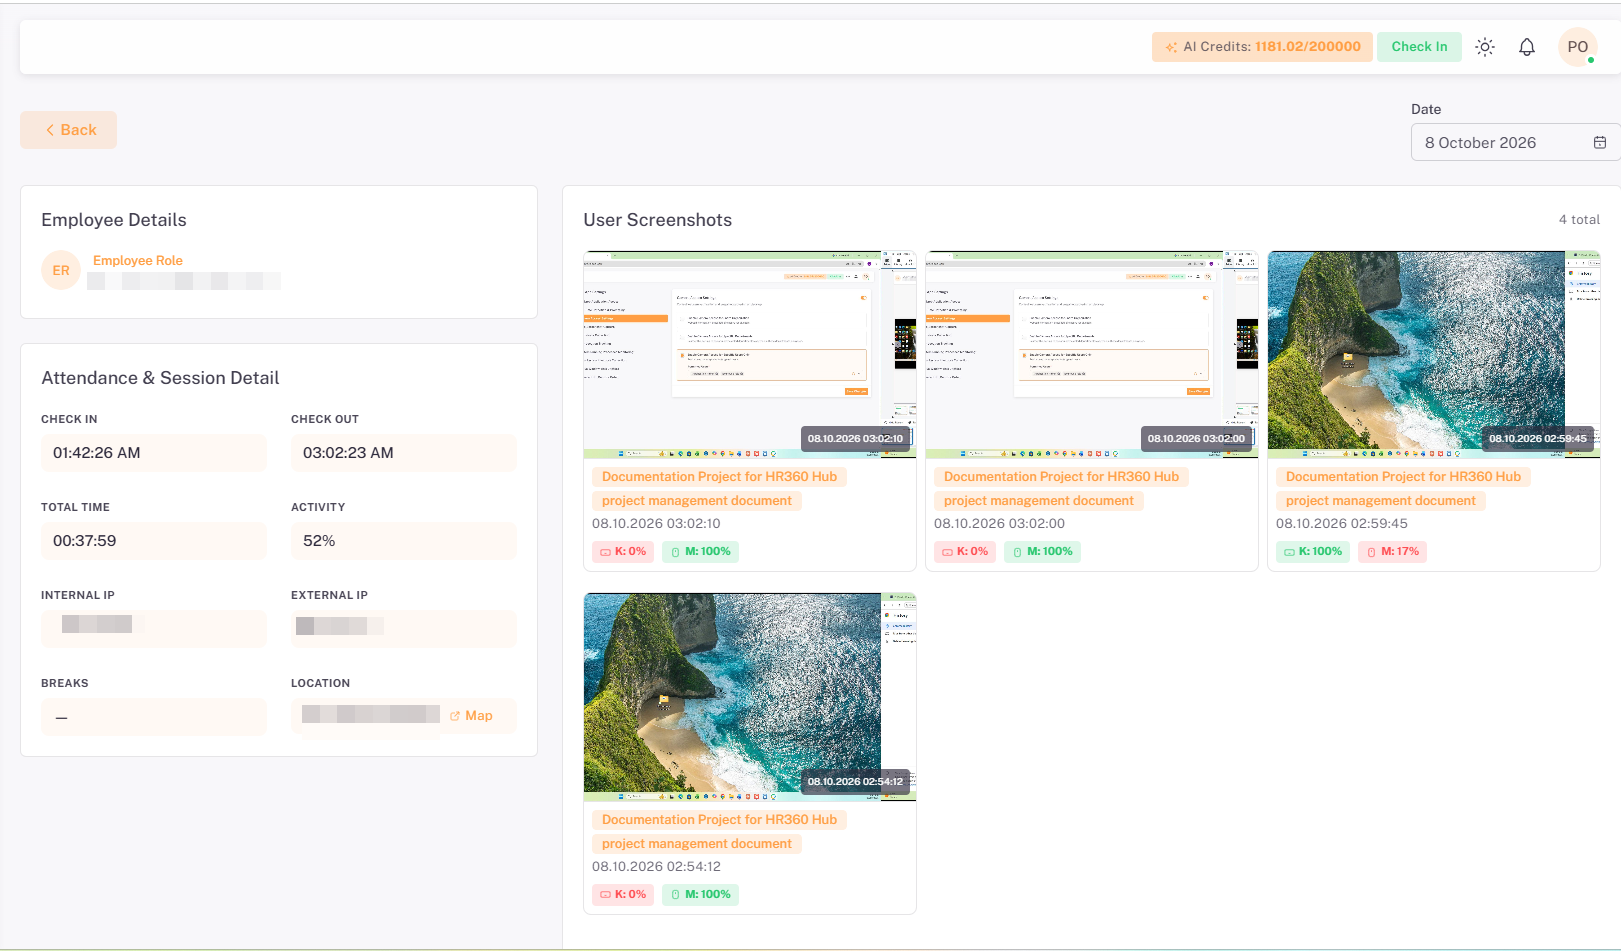
Clicking the eye icon opens the employee’s detail page.
Click Back to return to the listing, or use the Date selector in the top-right corner to view another day.
Section | Description |
Employee Details | The employee’s name and email address. |
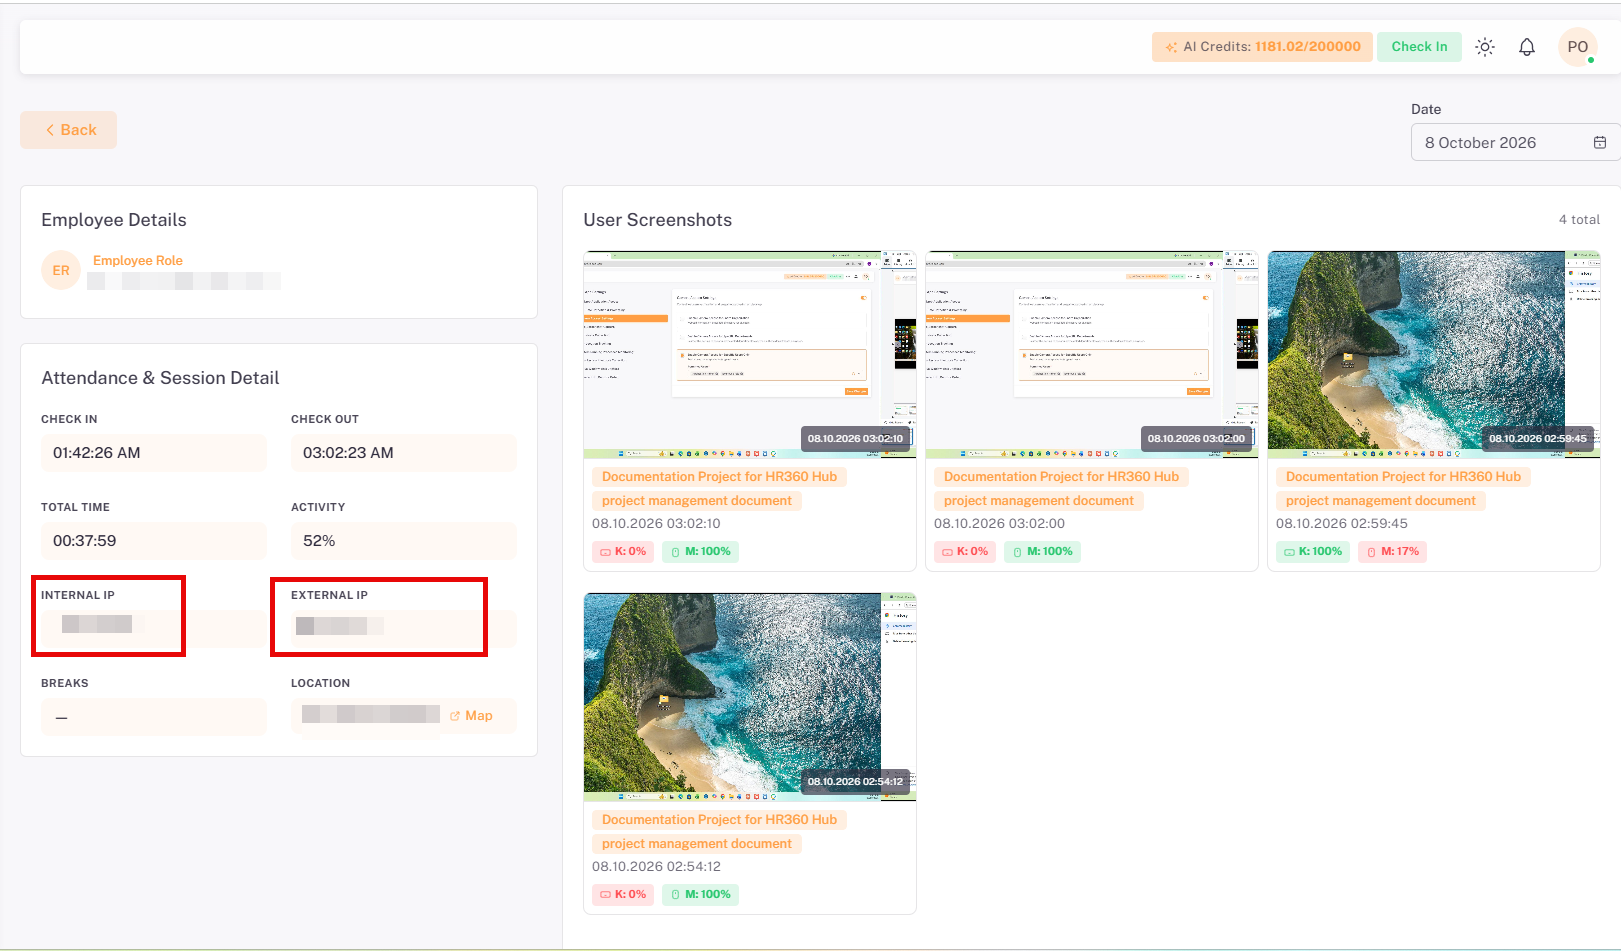
Attendance & Session Detail | Check In, Check Out, Total Time, Activity, Internal IP, External IP, Breaks, and Location for the selected date. A dash is shown where no value is available. |
User Screenshots | The total number of screenshots for the date, displayed as thumbnails with pagination. Each shows the capture time, the project and task, the capture date and time, and keyboard (K) and mouse (M) activity percentages. Hovering over a thumbnail shows an eye icon to view it. |
💡 Tip: Use the Date selector on the employee detail page to review screenshots from previous days without returning to the listing.
Section 6: IP Address Collection
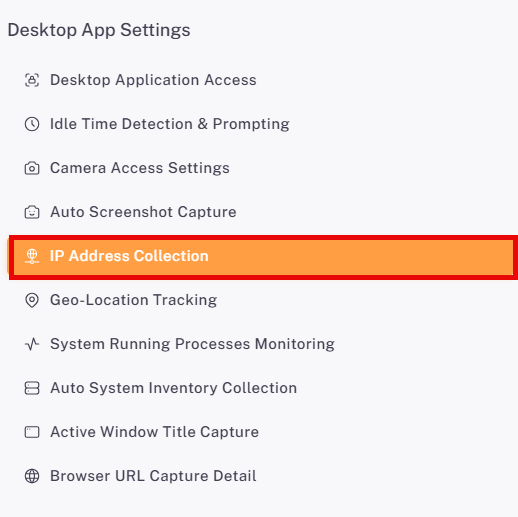
The IP Address Collection page logs IP addresses and network details for check-in security and geofencing. To open it, click IP Address Collection in the Desktop App Settings menu.
📜 Note: IP Address Collection is enabled by default.
6.1. Enabling IP Address Collection
Use the toggle in the top-right corner to turn the feature on or off. When it is on, three scope options control whose network details are logged.
Scope Option | Description | Additional Field |
Enable IP Collection for Entire Organization | Network IP addresses are logged for all desktop app sessions. | None |
Enable IP Collection for Specific Departments | Restricts the setting to one or more selected departments; everyone in those departments is covered. | Permitted Departments (required) |
Enable IP Collection for Specific Users Only | Log IP addresses only for selected users. | Permitted Users (required) |
6.2. Selecting the Scope
Select the option that matches who the setting should apply to. The selected option is highlighted with a border.
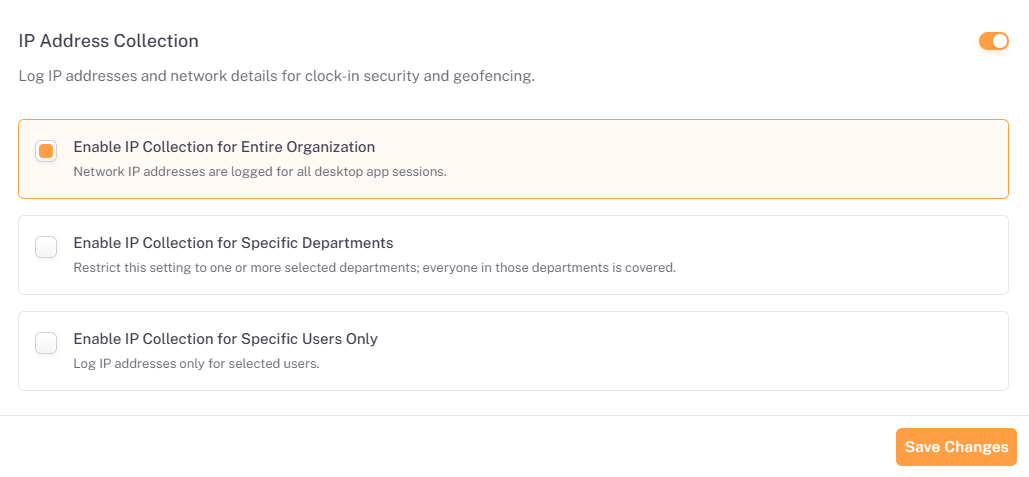
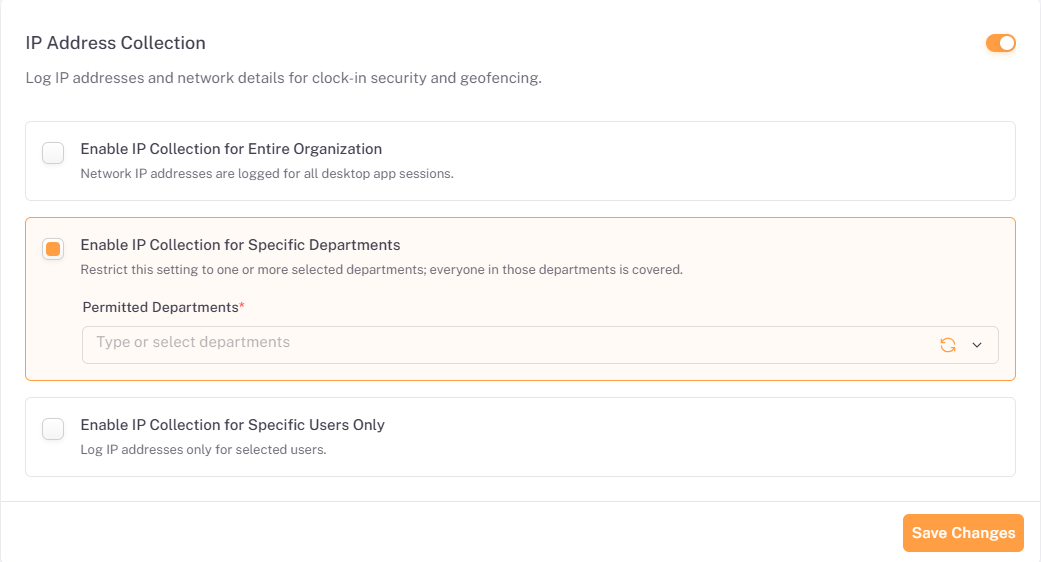
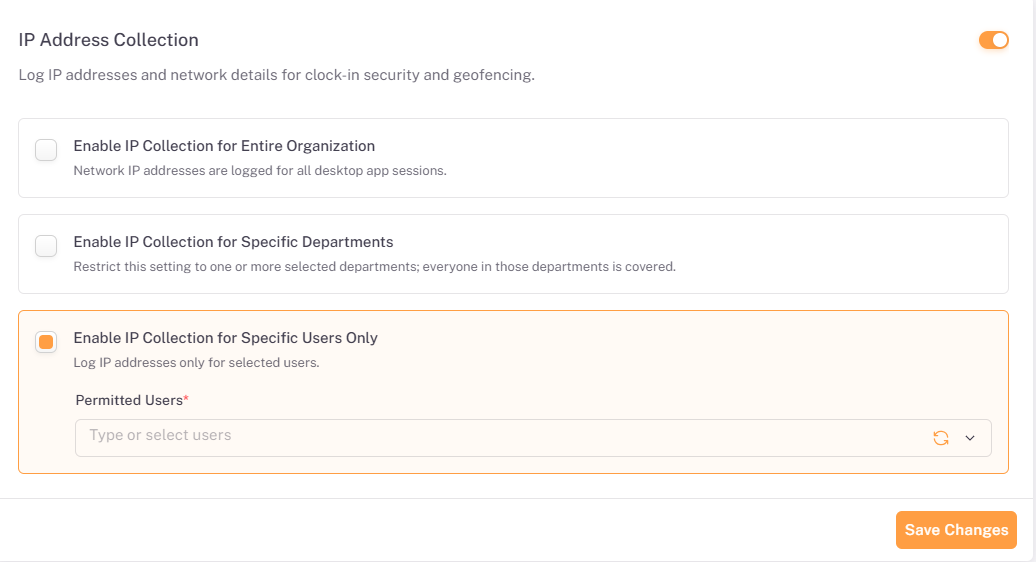
- Select the scope option you need.
- If you chose Specific Departments or Specific Users Only, click the Permitted Departments or Permitted Users field and type or select one or more entries.
- Click Save Changes to apply the setting.
📜 Note: Permitted Departments and Permitted Users are required fields (marked with a red asterisk). Use the refresh icon beside each field to reload the available options.
6.3. Where IP Addresses Are Displayed
The IP addresses captured by the desktop application are displayed in the following places:
Location | Path | Fields Shown |
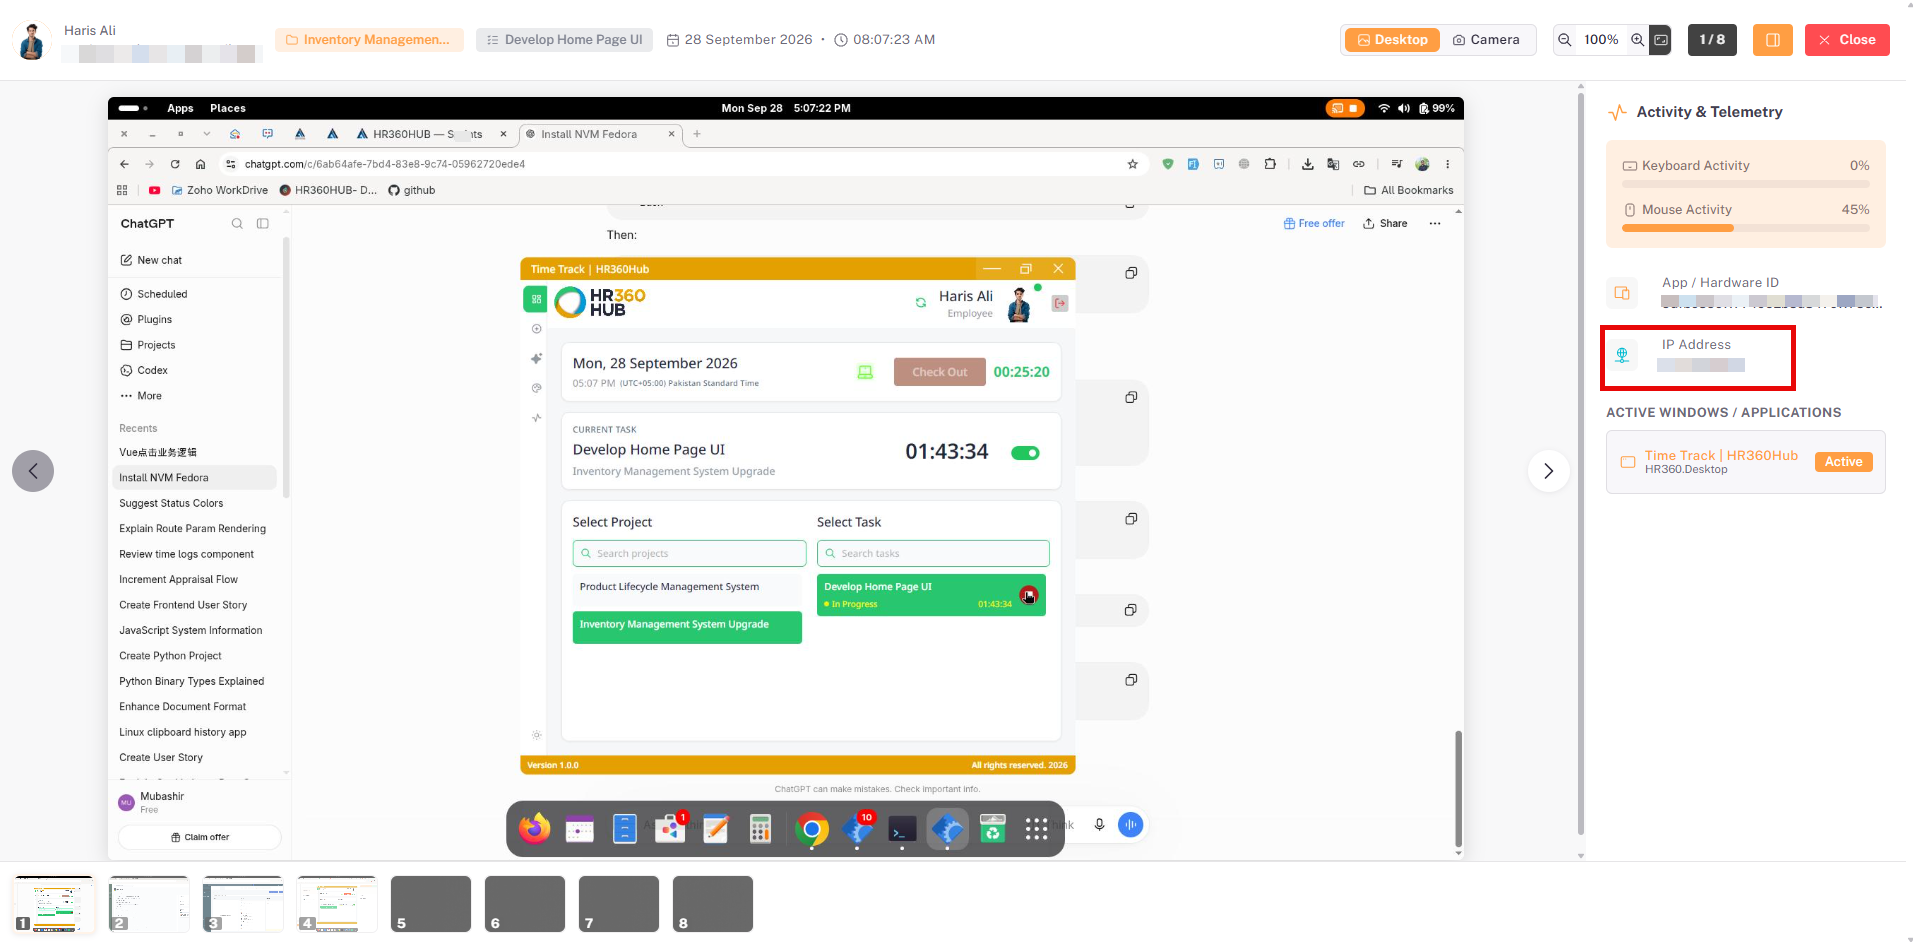
Attendance Screenshots | Attendance → Screenshots → Open a screenshot | IP Address, in the Activity & Telemetry panel of the screenshot viewer |
Daily Performance | Productivity Insights → Daily Performance → Eye icon | Internal IP and External IP, in Attendance & Session Detail |
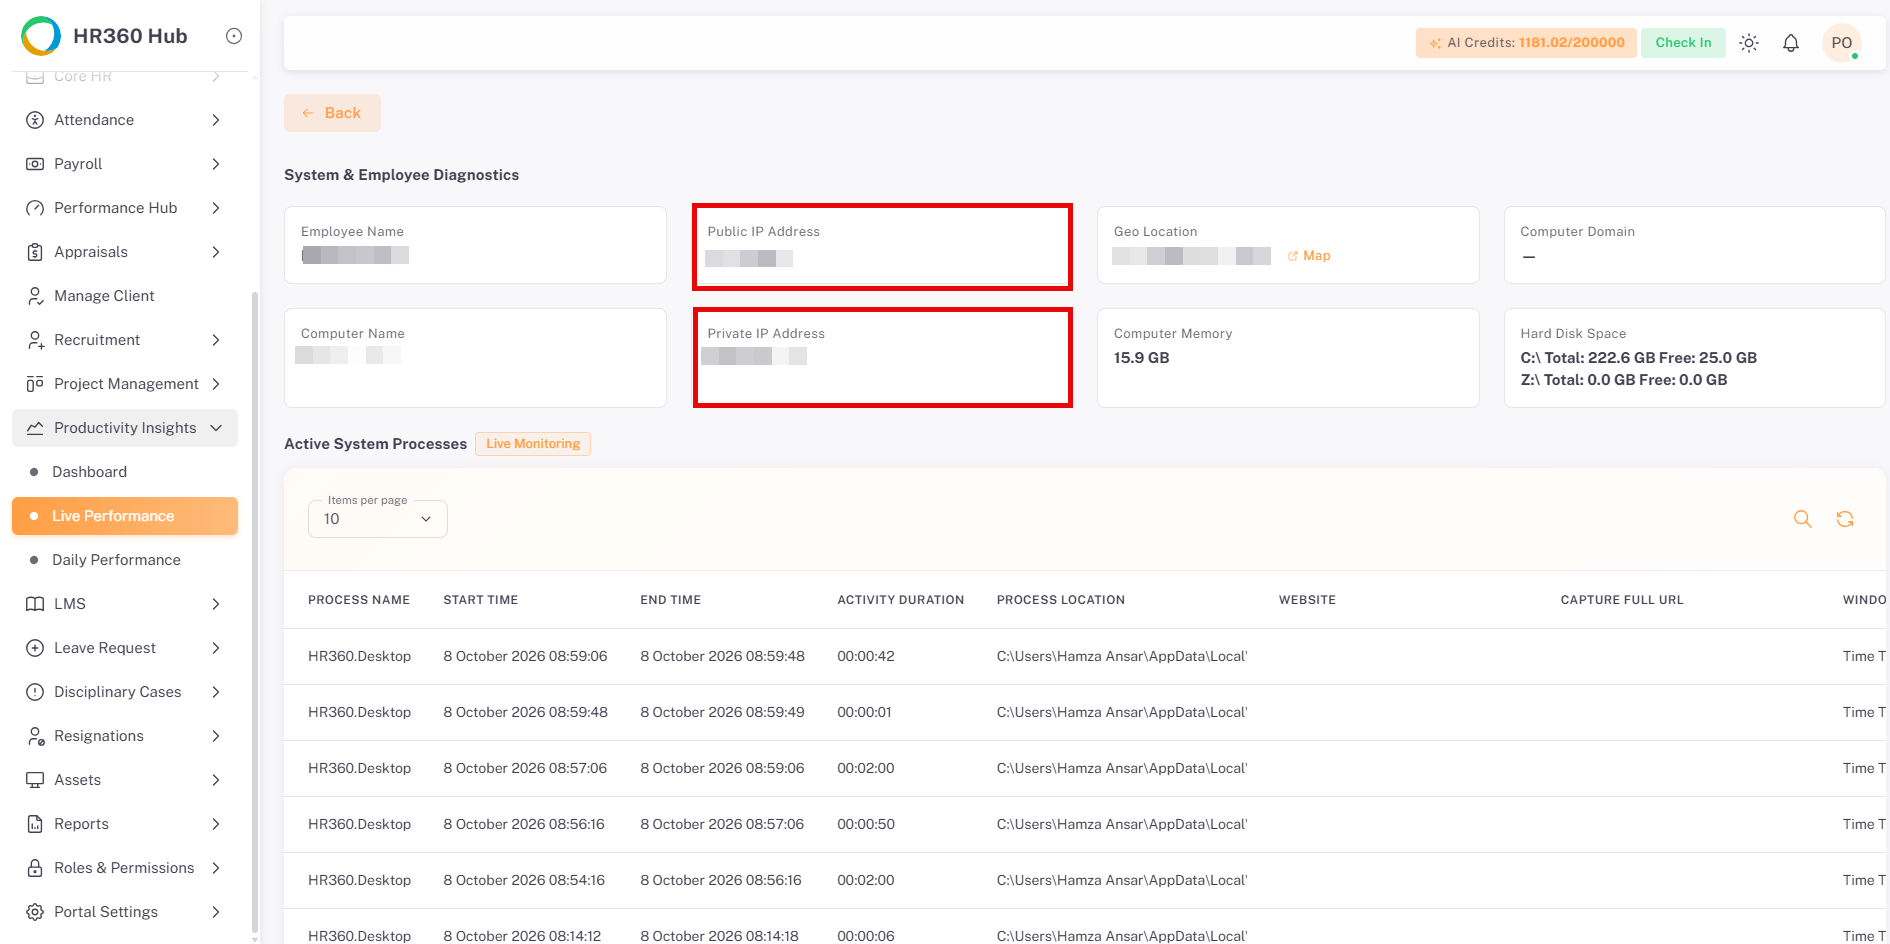
Live Performance | Productivity Insights → Live Performance → Employee details | Public IP Address and Private IP Address, in System & Employee Diagnostics |
6.3.1 Attendance Screenshots
6.3.2 Daily Performance
6.3.3 Live Performance
Section 7:Geo-Location Tracking
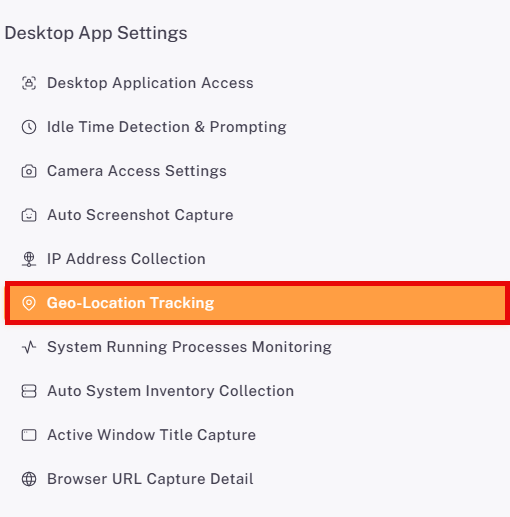
The Geo-Location Tracking page captures geographic location coordinates during active shift tracking. To open it, click Geo-Location Tracking in the Desktop App Settings menu.
⚠️ Important: Geo-Location Tracking is disabled by default and must be confirmed before it can be enabled.
7.1. Default State
Geo-Location Tracking is disabled by default. In this state the toggle is off, the three scope options are greyed out, and the Save Changes button is inactive.
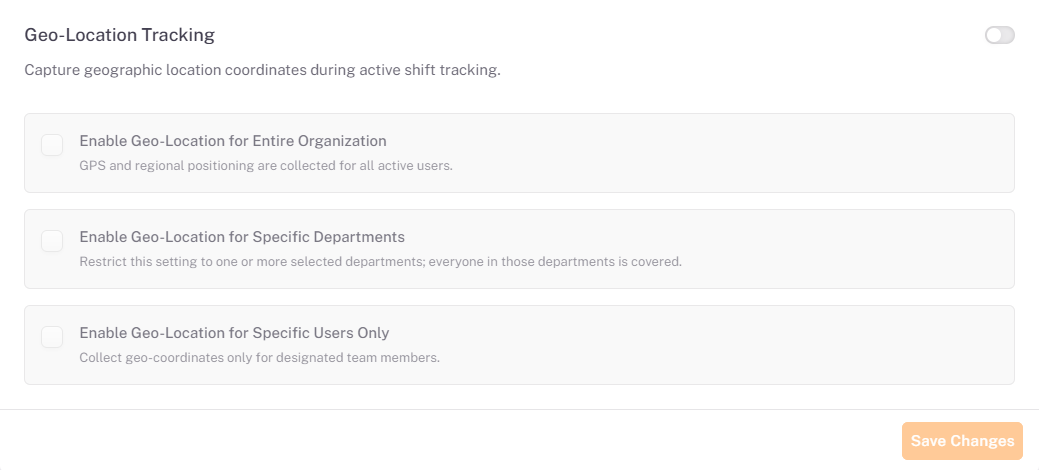
⚠️ Important: Geo-Location Tracking is treated as a compliance-sensitive data category. It cannot be enabled until the compliance confirmation described in Section 7.2 has been accepted.
7.2. Enabling Geo-Location Tracking
When the toggle is switched on, the Confirm Geo-Location Collection dialog appears before the setting is enabled.
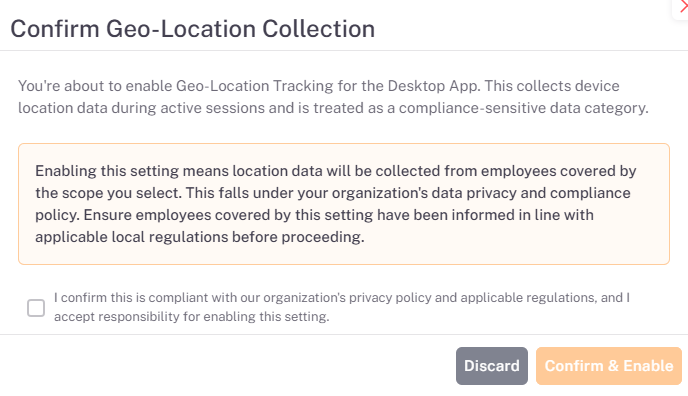
The dialog explains that enabling Geo-Location Tracking collects device location data during active sessions, and that location data will be collected from the employees covered by the scope you select. It also reminds you that the setting falls under your organization’s data privacy and compliance policy, and that employees covered by it must be informed in line with applicable local regulations.
- Switch on the Geo-Location Tracking toggle. The Confirm Geo-Location Collection dialog opens.
- Read the compliance notice displayed in the dialog.
- Tick the checkbox confirming that enabling this setting is compliant with the organization’s privacy policy and applicable regulations, and that you accept responsibility for enabling it.
- Click Confirm & Enable to proceed, or click Discard to close the dialog without enabling Geo-Location Tracking.
⚠️ Important: Confirm & Enable stays inactive until the confirmation checkbox is ticked. By confirming, you accept responsibility for enabling this setting.
7.3. Selecting the Scope
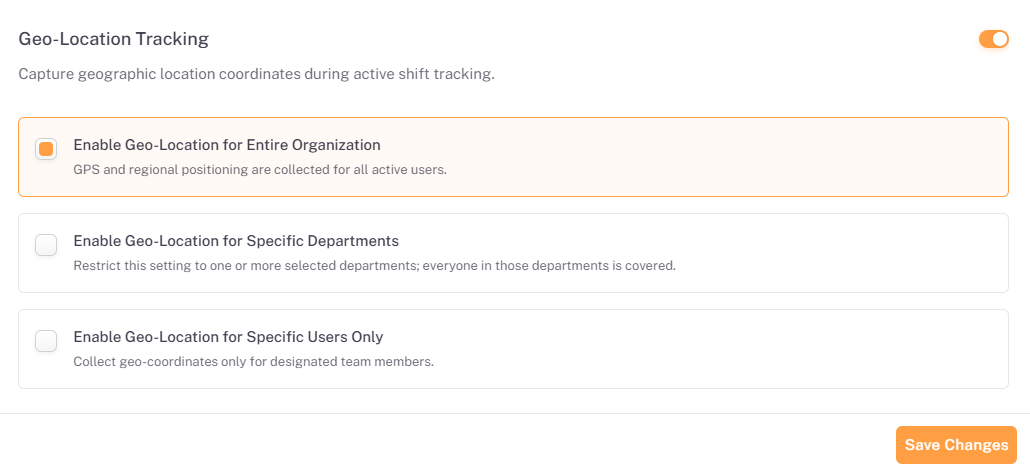
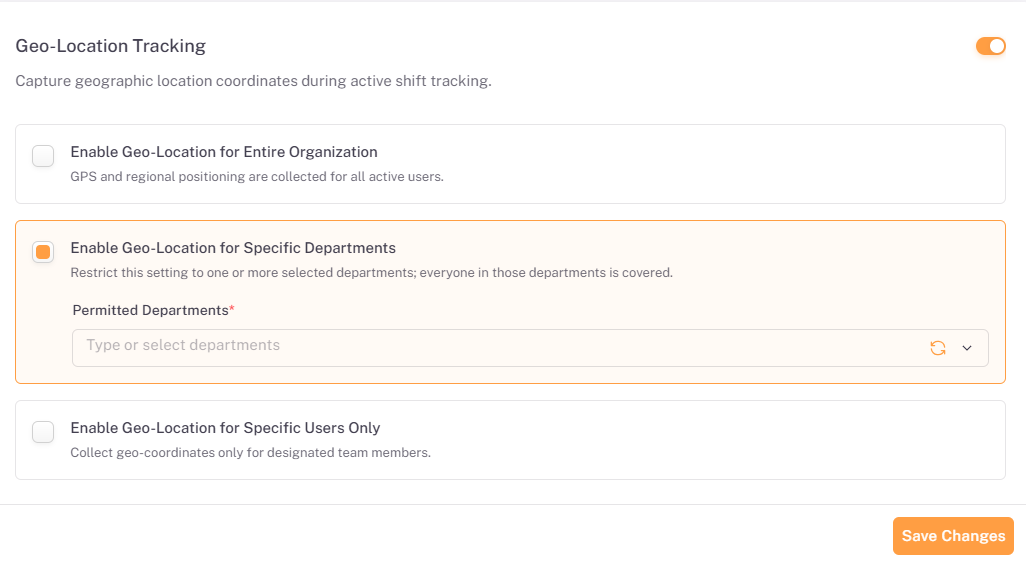
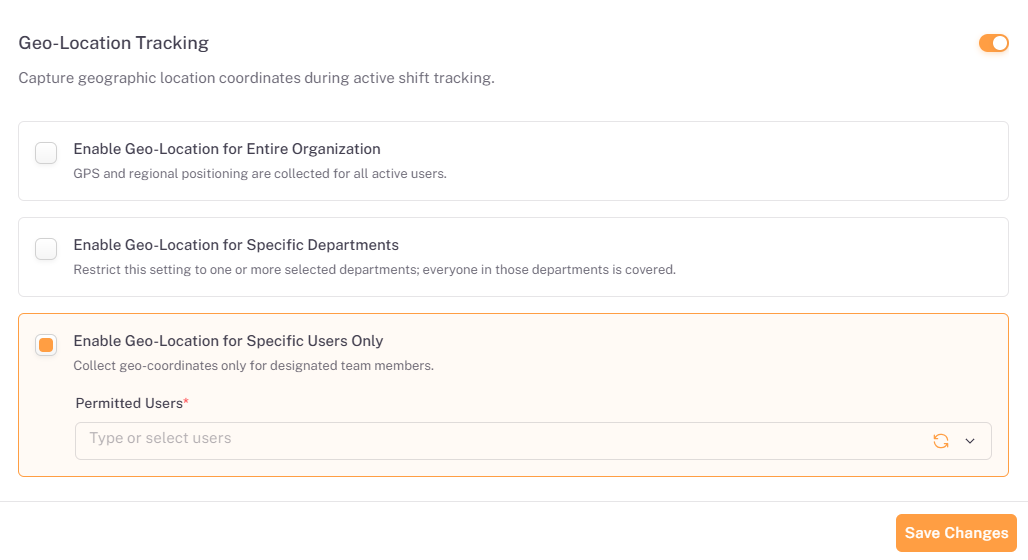
Once Geo-Location Tracking is enabled, the toggle turns orange, the three scope options become active, and Save Changes is available. Select who location data is collected from.
Scope Option | Description | Additional Field |
Enable Geo-Location for Entire Organization | GPS and regional positioning are collected for all active users. | None |
Enable Geo-Location for Specific Departments | Restricts the setting to one or more selected departments; everyone in those departments is covered. | Permitted Departments (required) |
Enable Geo-Location for Specific Users Only | Collects geo-coordinates only for designated team members. | Permitted Users (required) |
- Select the scope option you need.
- If you chose Specific Departments or Specific Users Only, click the Permitted Departments or Permitted Users field and type or select one or more entries.
- Click Save Changes to apply the setting.
📜 Note: Permitted Departments and Permitted Users are required fields (marked with a red asterisk). Use the refresh icon beside each field to reload the available options.
7.4. Location Prompt on the Desktop App
When Geo-Location Tracking is enabled, users covered by the selected scope receive a prompt on the desktop application asking for permission to share their geo-location.
⚠️ Important: If the user rejects the location prompt, they will not be able to check in to the desktop app.
7.5. Where Location Data Is Displayed
The geo-location details captured by the desktop application are available in the following places:
Location | Path |
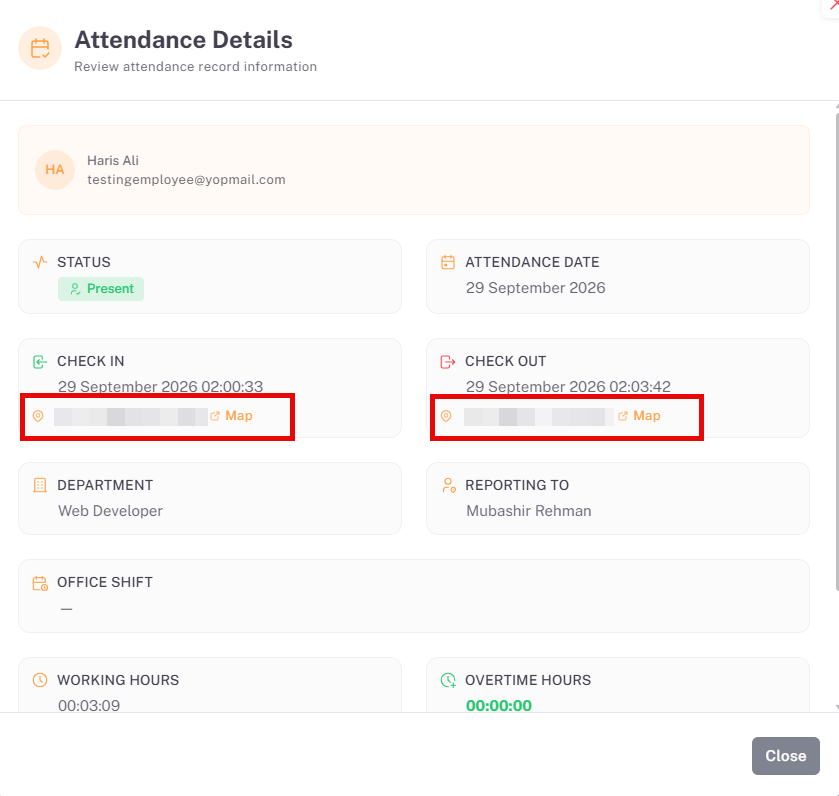
Attendance Details | Attendance → Employee Attendance → Click on view to view Attendance details. The location is shown in Check in & Check Out details |
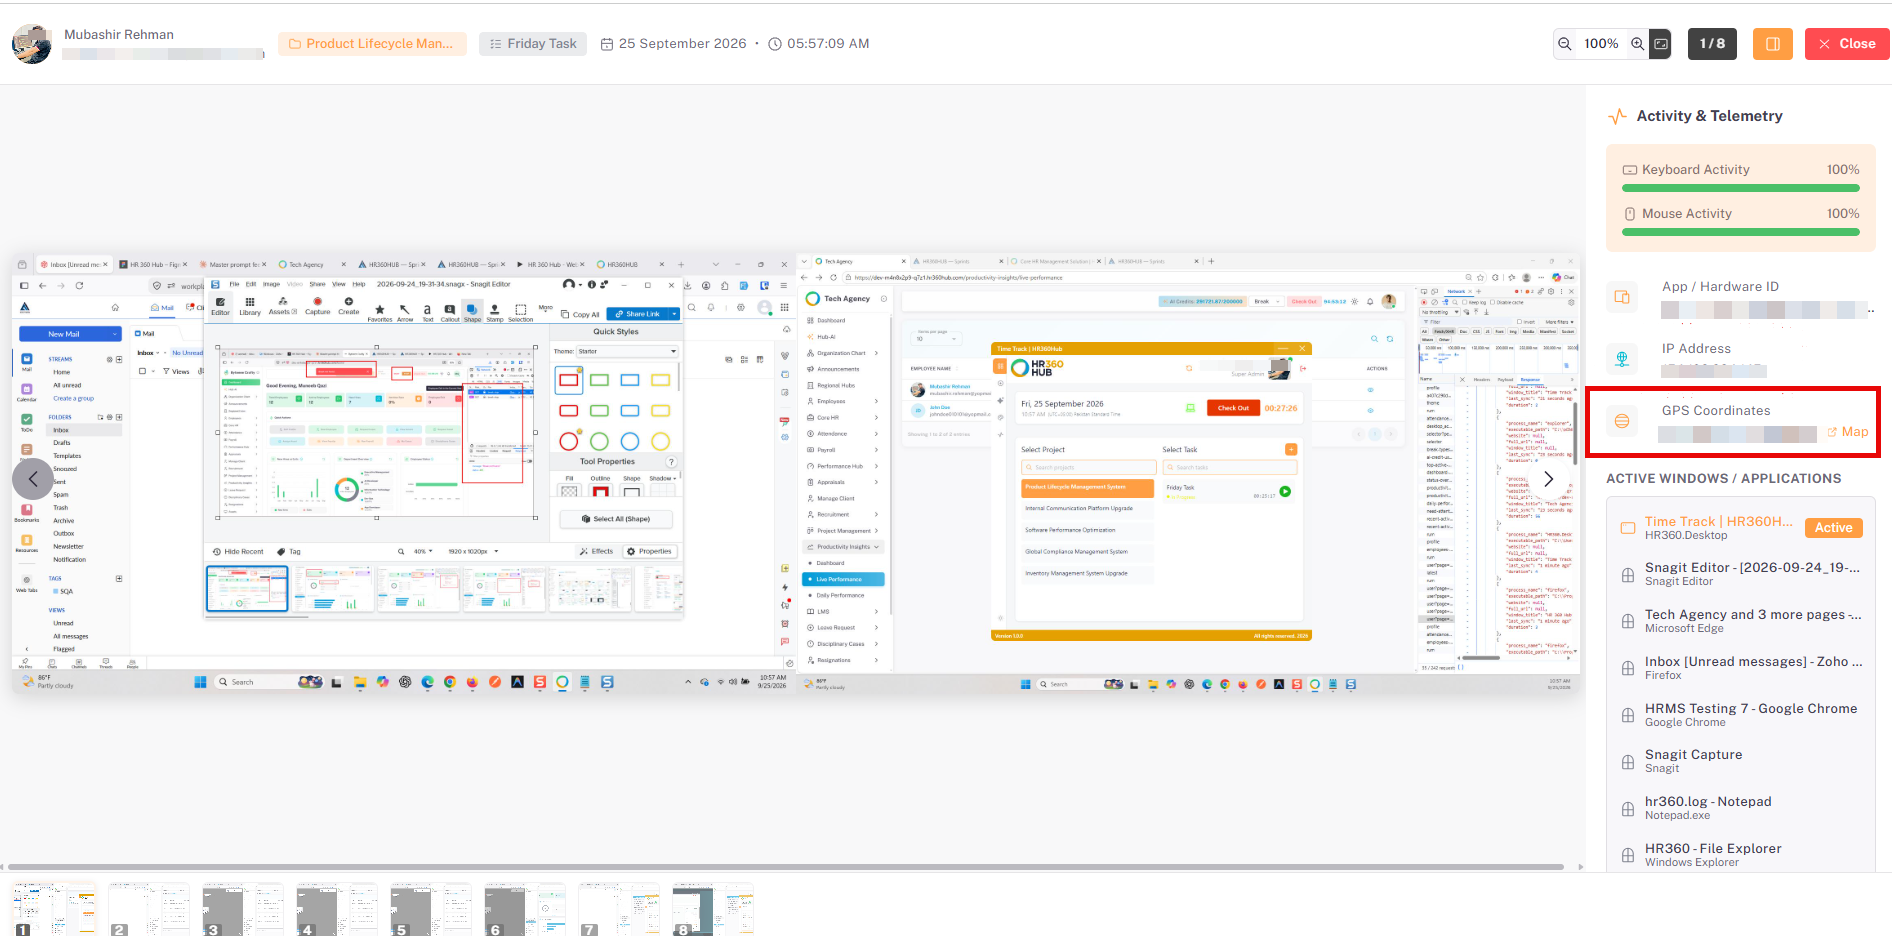
Attendance Screenshots | Attendance → Screenshots → Open a screenshot. The Activity & Telemetry panel of the screenshot viewer shows the GPS Coordinates, with a Map link. |
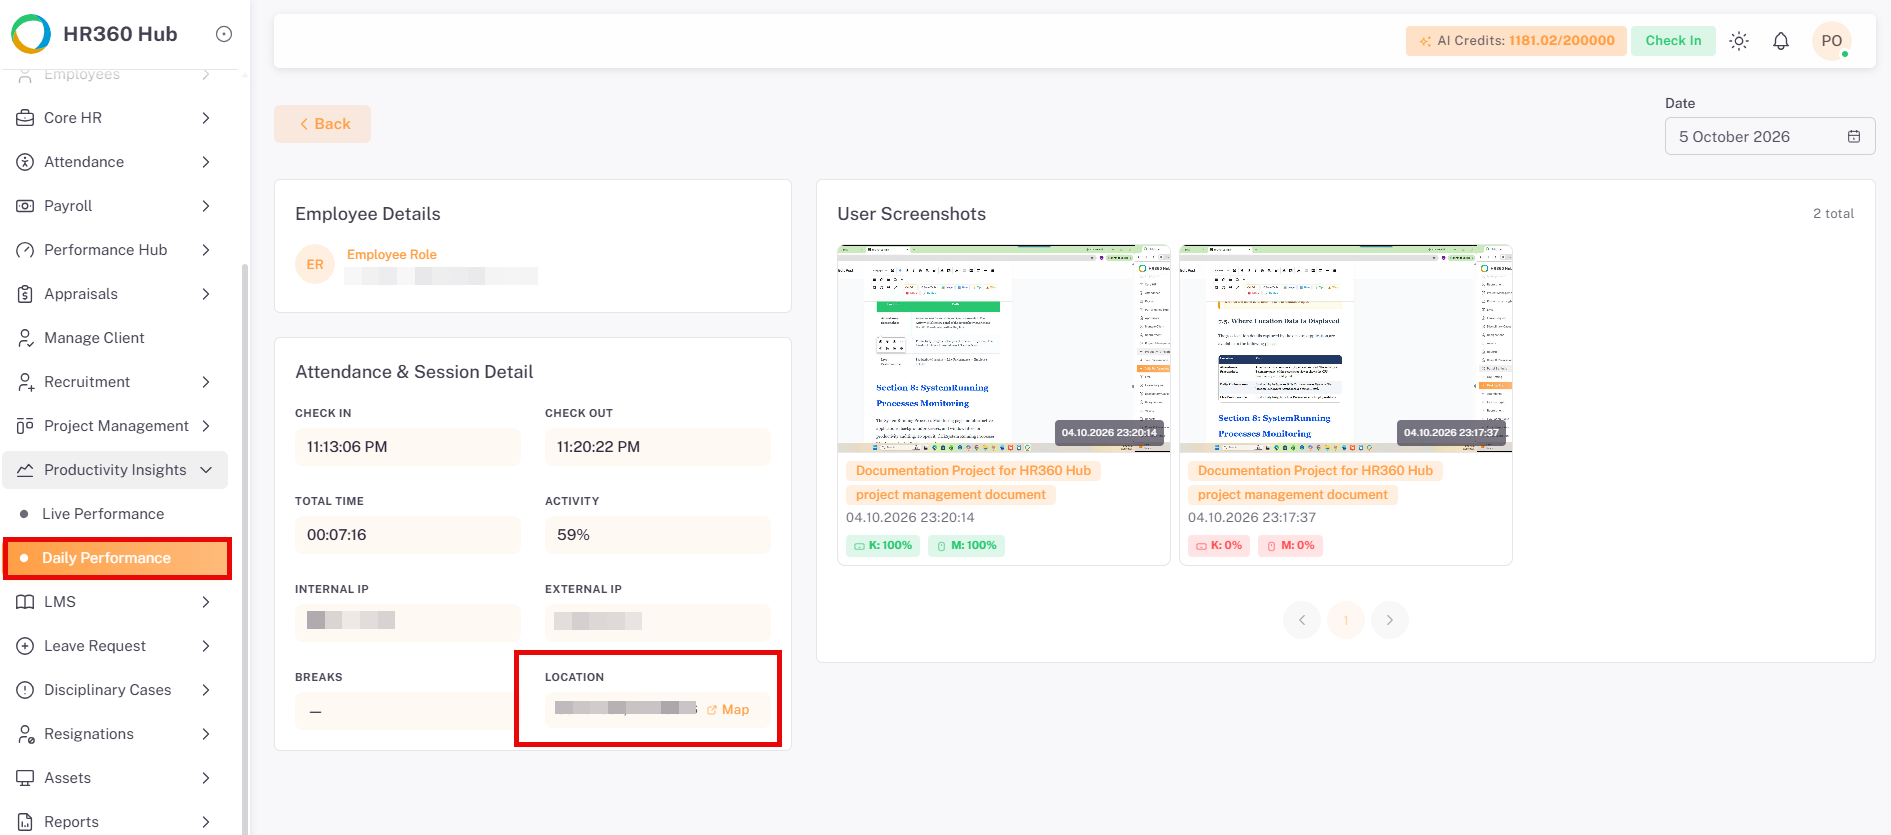
Daily Performance | Productivity Insights → Daily Performance → Eye icon. The location is shown in Attendance & Session Detail. |
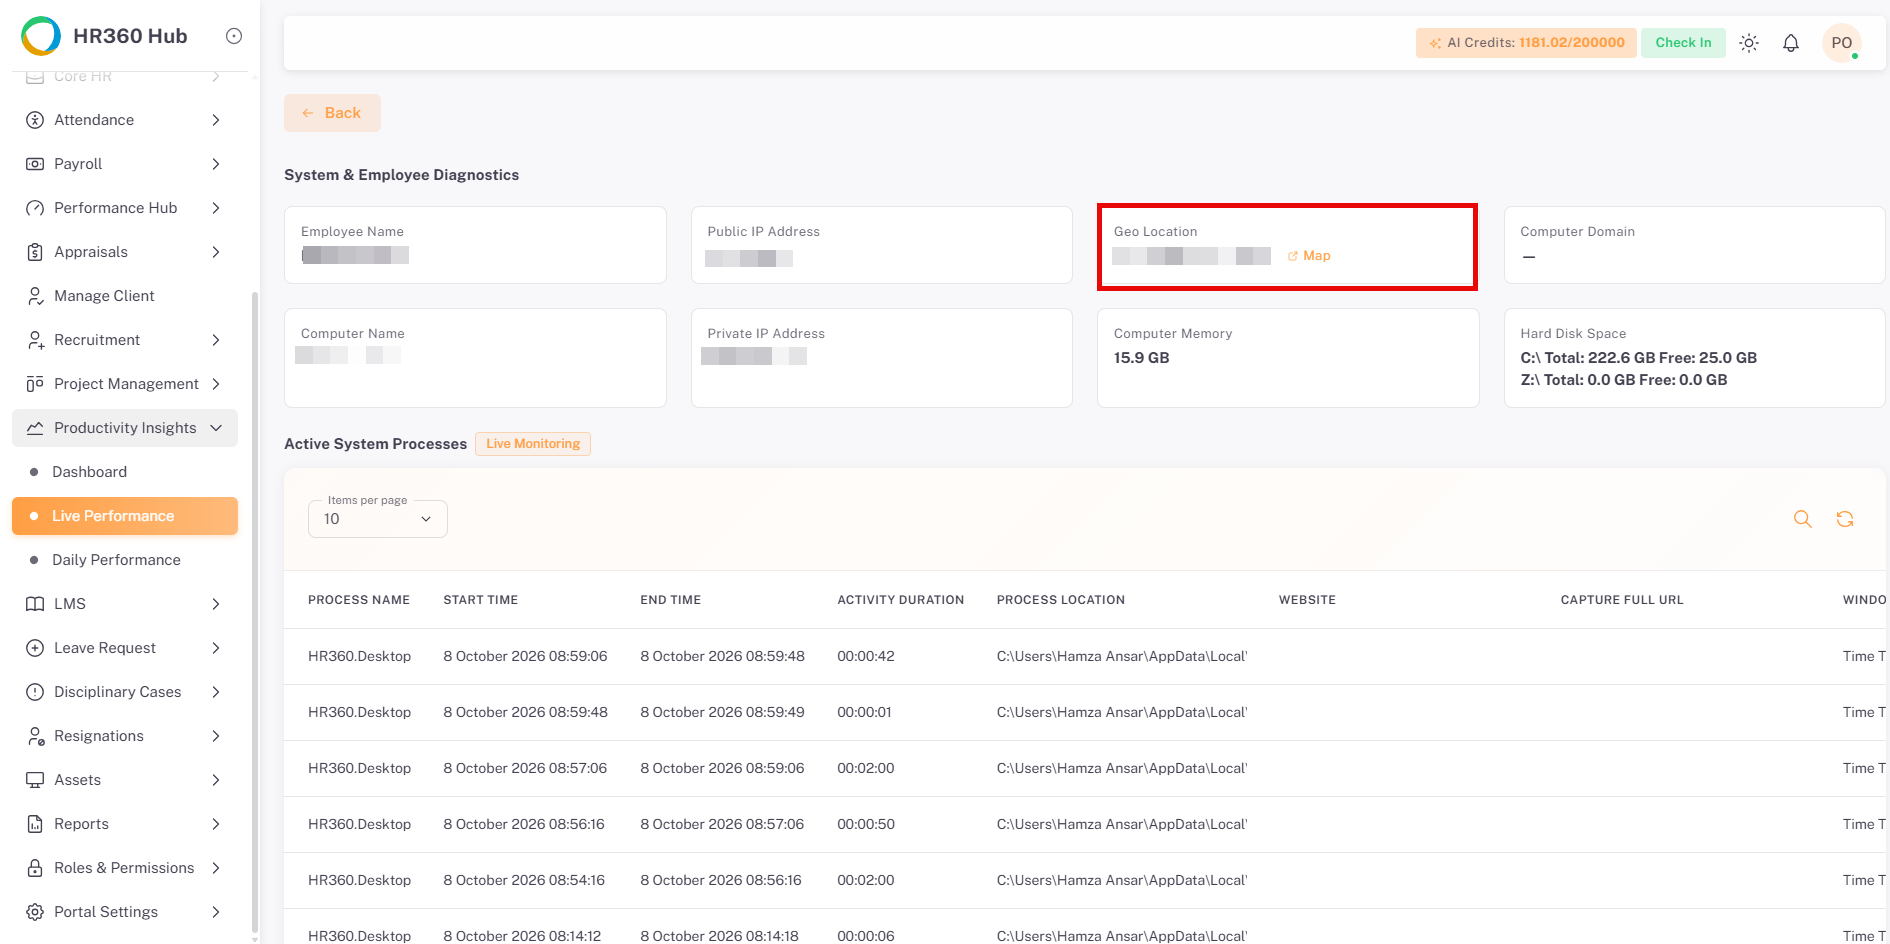
Live Performance | Productivity Insights → Live Performance → Employee details. |
7.5.1 Attendance Details
7.5.2 Attendance Screenshots
7.5.3 Daily Performance
7.5.4 Live Performance
Section 8: System Running Processes Monitoring
The System Running Processes Monitoring page monitors active applications, background processes, and window titles for productivity auditing. To open it, click System Running Processes Monitoring in the Desktop App Settings menu.
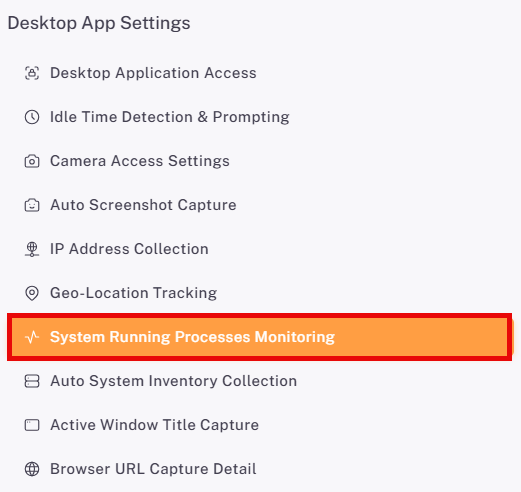
📜 Note: System Running Processes Monitoring are enabled by default. If disabled the details would not be shown along with the screenshots.
8.1. Enabling System Running Processes Monitoring
Use the toggle in the top-right corner to turn the feature on or off. When it is on, three scope options control whose process activity is logged.
Scope Option | Description | Additional Field |
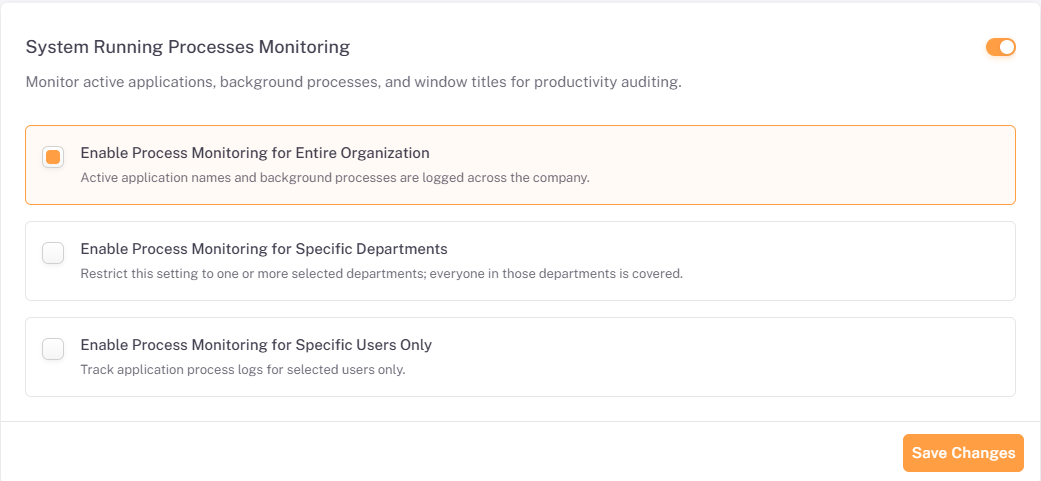
Enable Process Monitoring for Entire Organization | Active application names and background processes are logged across the company. | None |
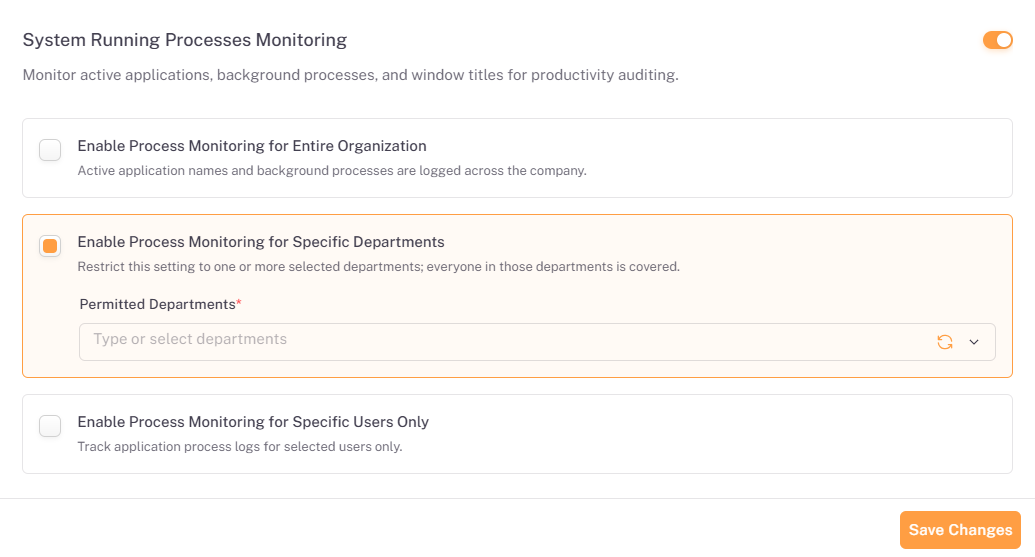
Enable Process Monitoring for Specific Departments | Restricts the setting to one or more selected departments; everyone in those departments is covered. | Permitted Departments (required) |
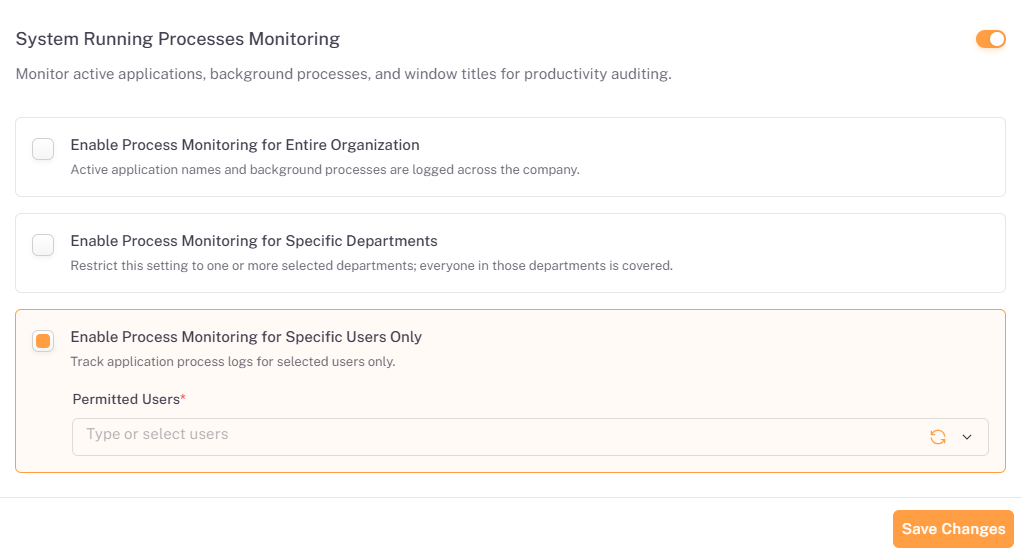
Enable Process Monitoring for Specific Users Only | Track application process logs for selected users only. | Permitted Users (required) |
8.2. Selecting the Scope
Select the option that matches who the setting should apply to. The selected option is highlighted with a border.
- Select the scope option you need.
- If you chose Specific Departments or Specific Users Only, click the Permitted Departments or Permitted Users field and type or select one or more entries.
- Click Save Changes to apply the setting.
📜 Note: Permitted Departments and Permitted Users are required fields (marked with a red asterisk). Use the refresh icon beside each field to reload the available options.
8.3. Where Process Data Is Displayed
When System Running Processes Monitoring is enabled, the captured process data is shown in the following places:
Location | Path |
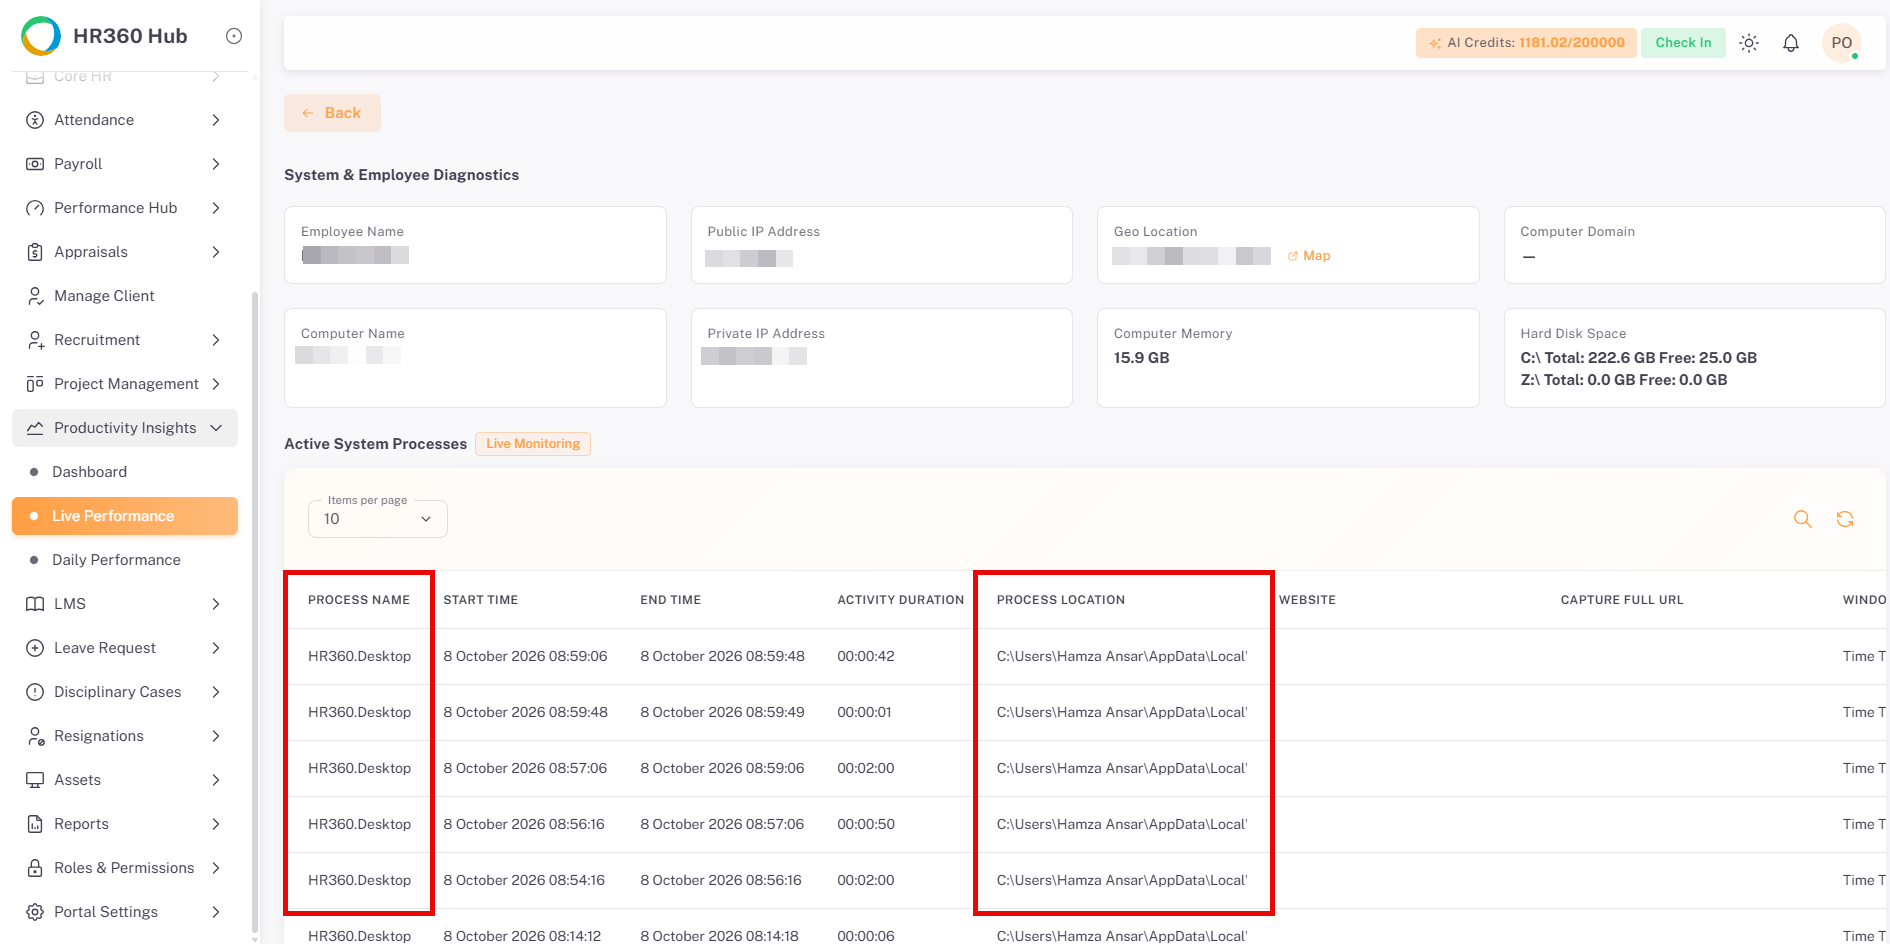
Live Performance | Productivity Insights → Live Performance → Employee details. The data appears in the Active System Processes table. |
Daily Performance | Productivity Insights → Daily Performance → Eye icon → Screenshot details. |
Attendance Screenshots | Attendance → Screenshots → Open a screenshot. The Active Windows / Applications list in the screenshot viewer shows the running applications. |
📜 Note: If System Running Processes Monitoring is disabled, process data is not shown in the screenshot details.
⚠️Important: Process data is captured together with screenshots. If screenshot capture is not enabled for the desktop app, the process data is not captured.
8.3.1 Live Performance:
8.3.2 Attendance & Daily Performance Screenshots
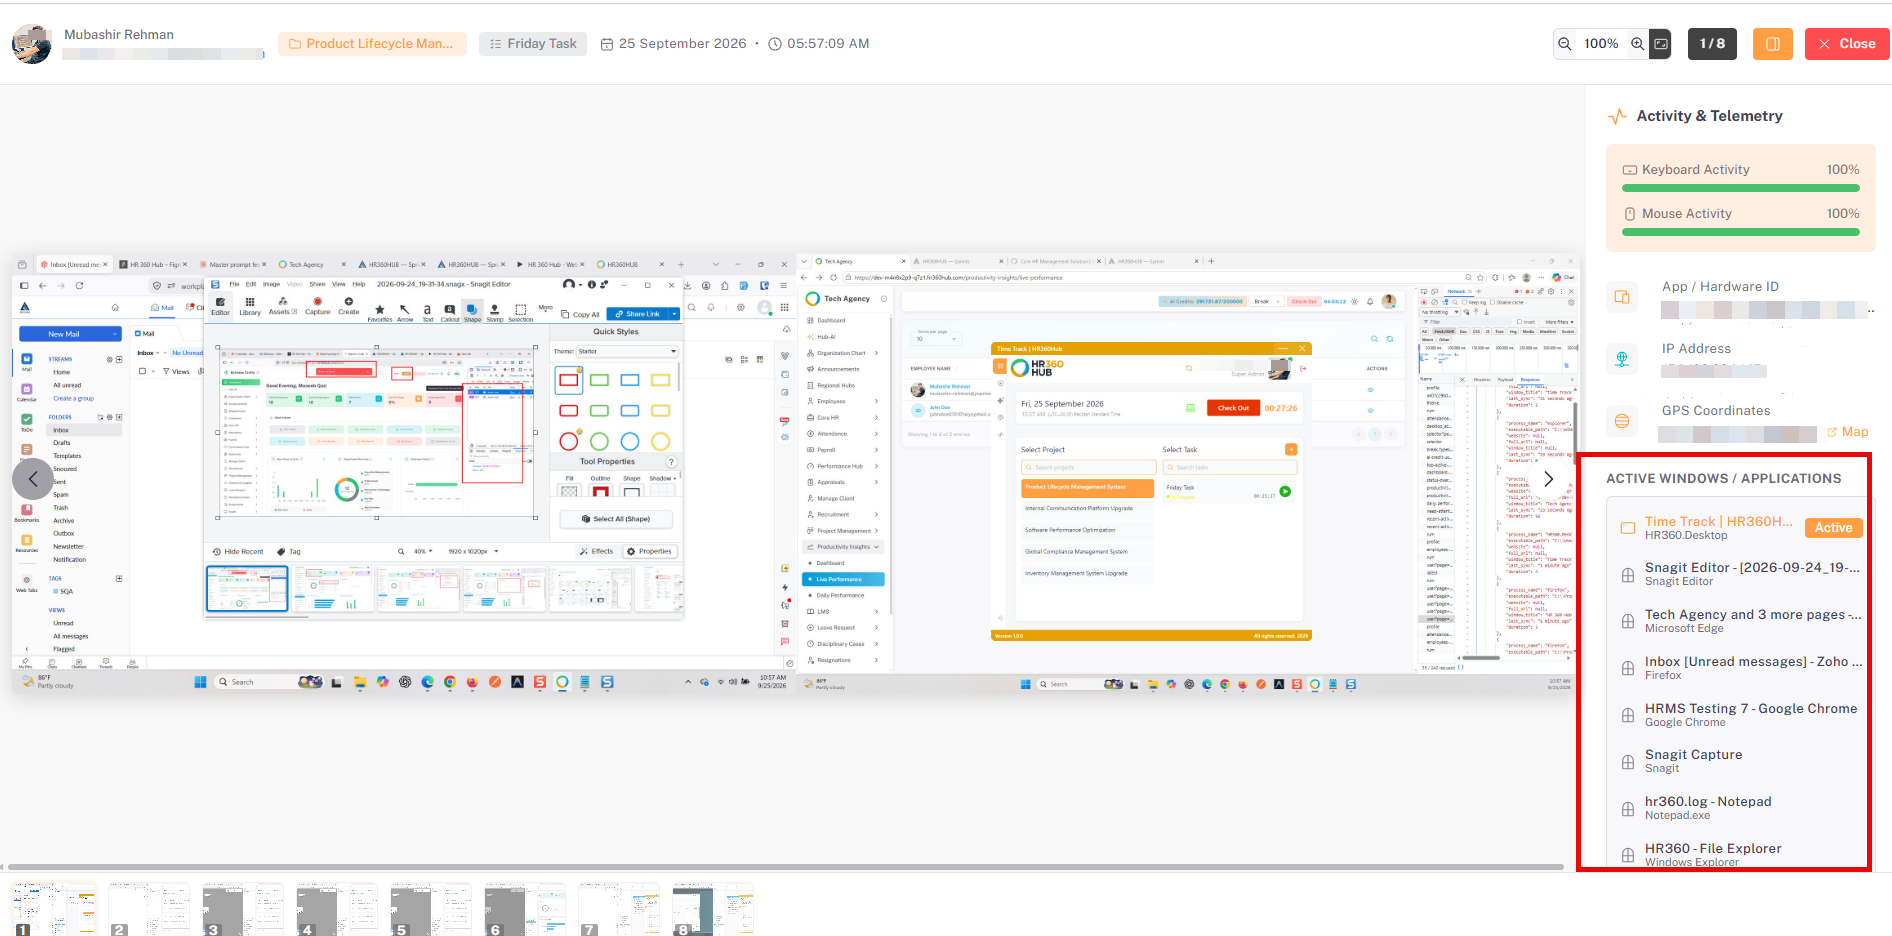
📜 Note: Productivity Insights → Daily Performance Screenshots give the same as Attendance Screenshot view of Running Processes
Section 9: Auto System Inventory Collection
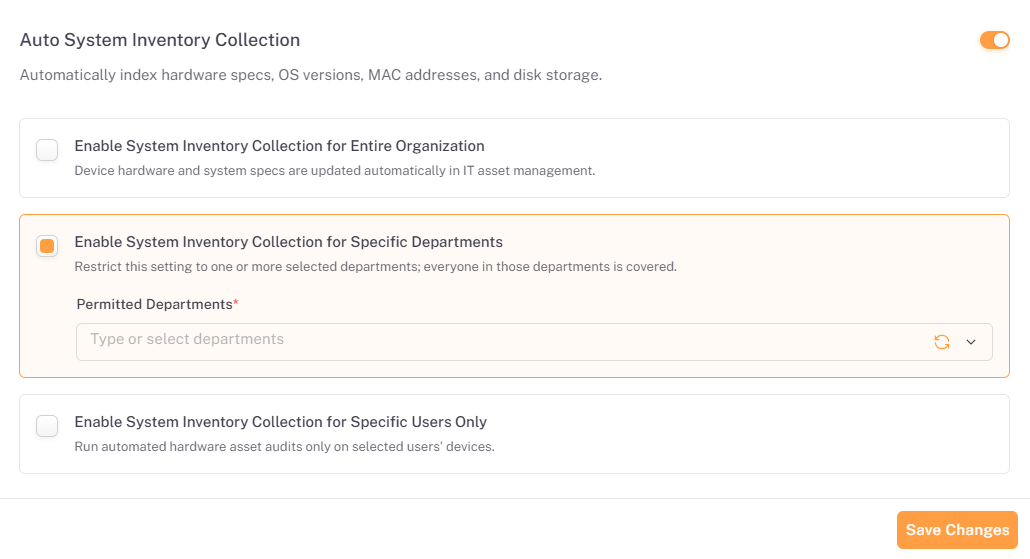
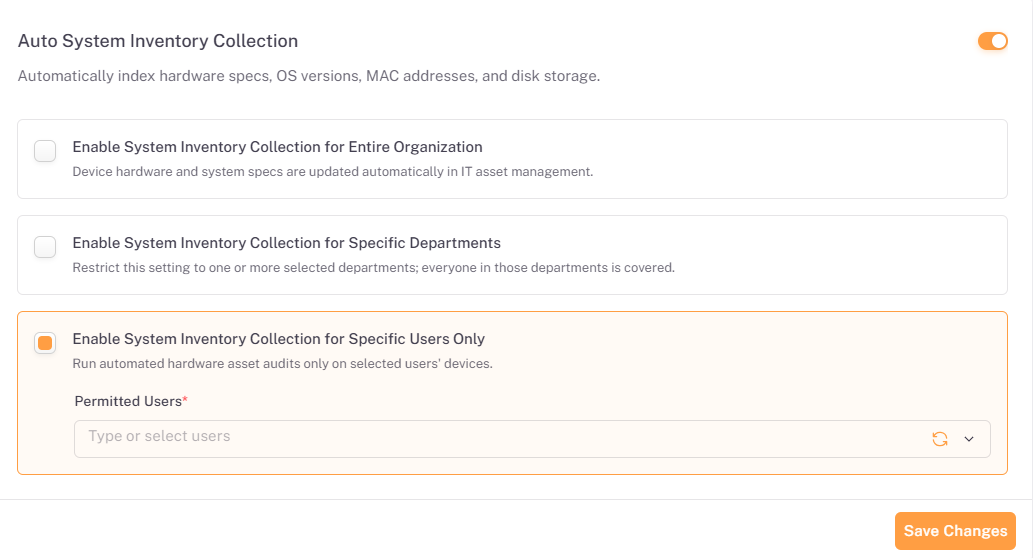
The Auto System Inventory Collection page automatically indexes Computer Domain, Computer Name, Computer Memory and Hard Disk Space of devices running the desktop application. To open it, click Auto System Inventory Collection in the Desktop App Settings menu.
📜 Note: Auto System Inventory Collection is enabled by default.
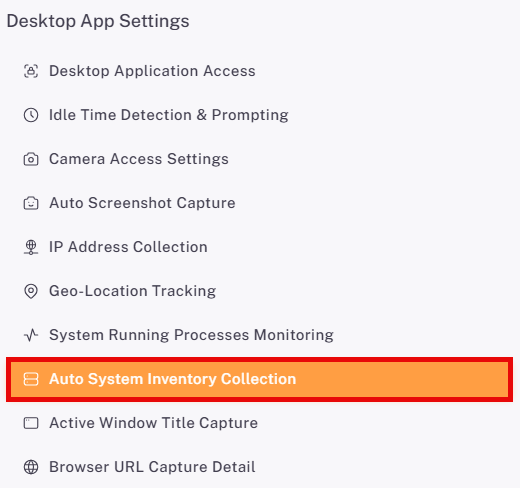
9.1. Enabling Auto System Inventory Collection
Use the toggle in the top-right corner to turn the feature on or off. When it is on, three scope options control which devices are audited.
Scope Option | Description | Additional Field |
Enable System Inventory Collection for Entire Organization | Device hardware and system specs are updated automatically in IT asset management. | None |
Enable System Inventory Collection for Specific Departments | Restricts the setting to one or more selected departments; everyone in those departments is covered. | Permitted Departments (required) |
Enable System Inventory Collection for Specific Users Only | Run automated hardware asset audits only on selected users’ devices. | Permitted Users (required) |
9.2. Selecting the Scope
Select the option that matches who the setting should apply to. The selected option is highlighted with a border.
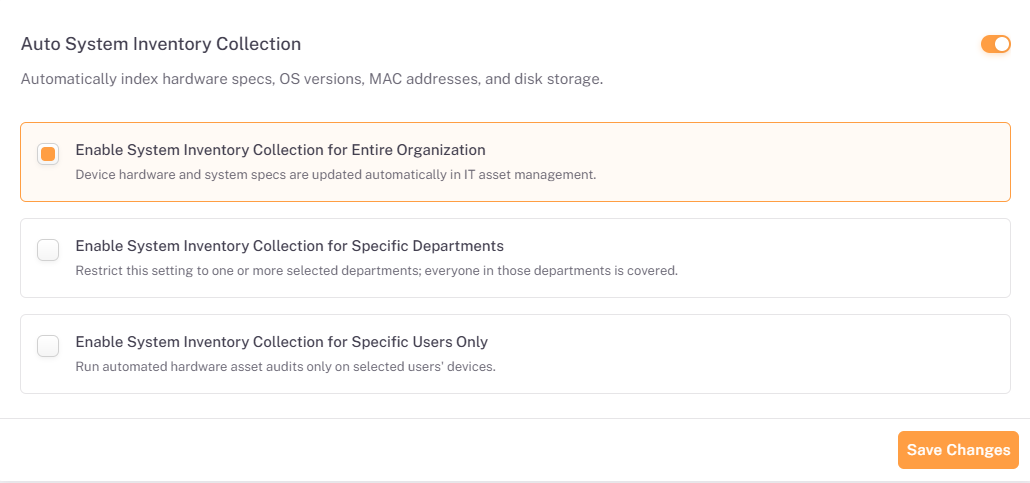
- Select the scope option you need.
- If you chose Specific Departments or Specific Users Only, click the Permitted Departments or Permitted Users field and type or select one or more entries.
- Click Save Changes to apply the setting.
📜 Note: Permitted Departments and Permitted Users are required fields (marked with a red asterisk). Use the refresh icon beside each field to reload the available options.
9.3. Where Inventory Data Is Displayed
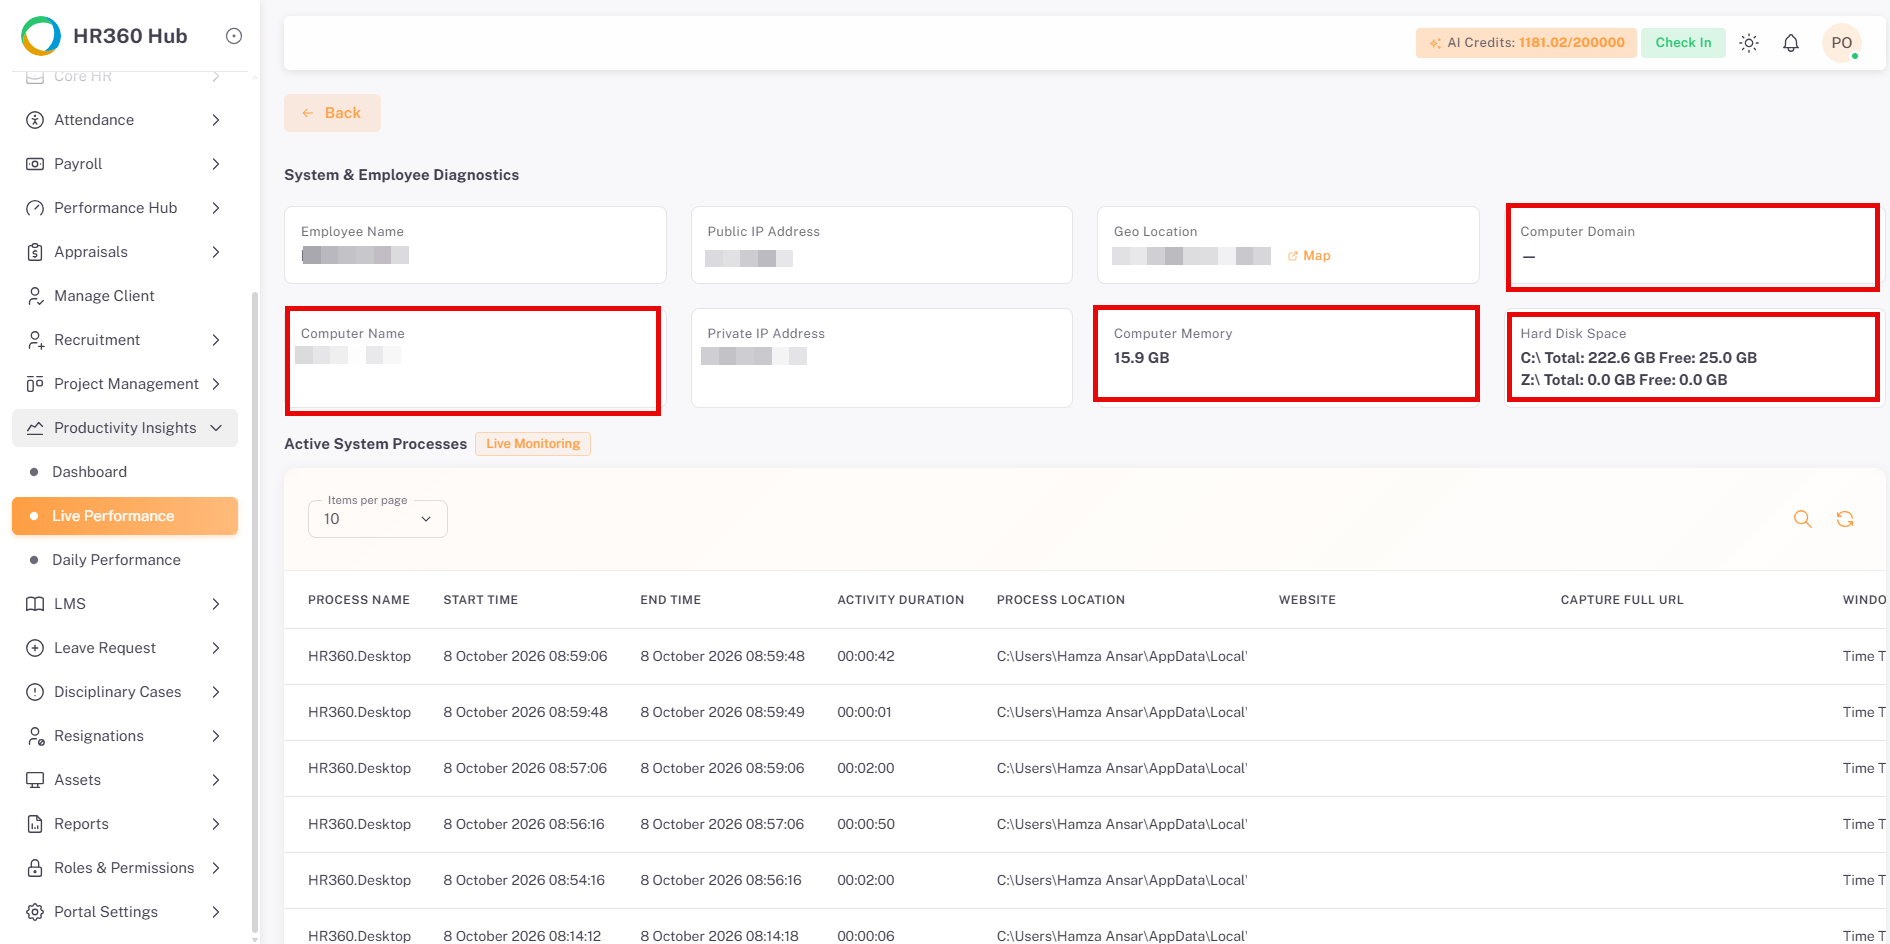
The collected inventory data can be seen in Productivity Insights → Live Performance, in the System & Employee Diagnostics panel of the employee’s details. It shows the following details:
Field | Description |
Computer Domain | The domain the employee’s computer belongs to. A dash is shown if there is none. |
Computer Name | The name of the employee’s computer. |
Computer Memory | The memory installed on the computer. |
Hard Disk Space | The total and free space of the computer’s disk. |
Section 10: Active Window Title Capture
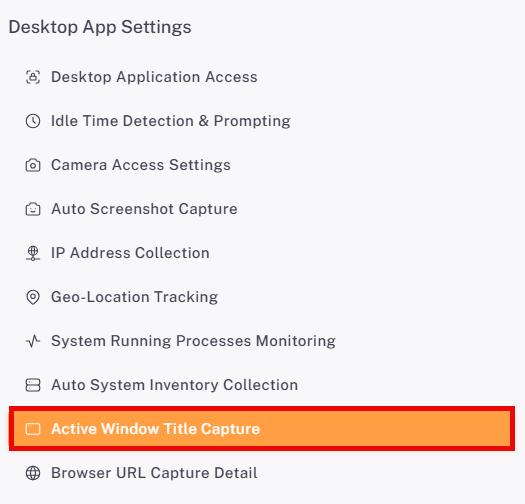
The Active Window Title Capture page records the title of the active application window alongside tracked activity, for context on what was being worked on. To open it, click Active Window Title Capture in the Desktop App Settings menu.
📜 Note: Active Window Title Capture is enabled by default.
10.1. Enabling Active Window Title Capture
Use the toggle in the top-right corner to turn the feature on or off. When it is on, three scope options control whose window titles are recorded.
Scope Option | Description | Additional Field |
Enable Window Title Capture for Entire Organization | Window titles are recorded for all tracked sessions. | None |
Enable Window Title Capture for Specific Departments | Restricts the setting to one or more selected departments; everyone in those departments is covered. | Permitted Departments (required) |
Enable Window Title Capture for Specific Users Only | Records window titles only for selected team members. | Permitted Users (required) |
10.2. Selecting the Scope
Select the option that matches who the setting should apply to. The selected option is highlighted with a border.
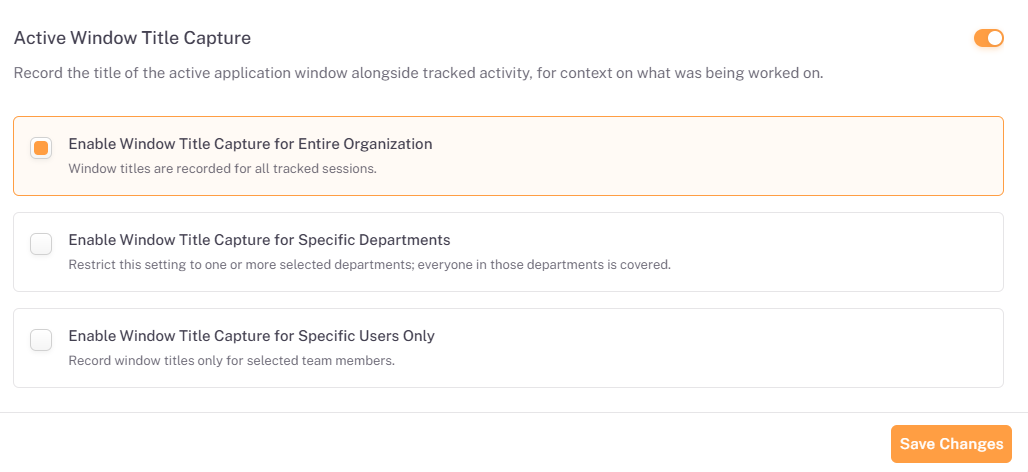
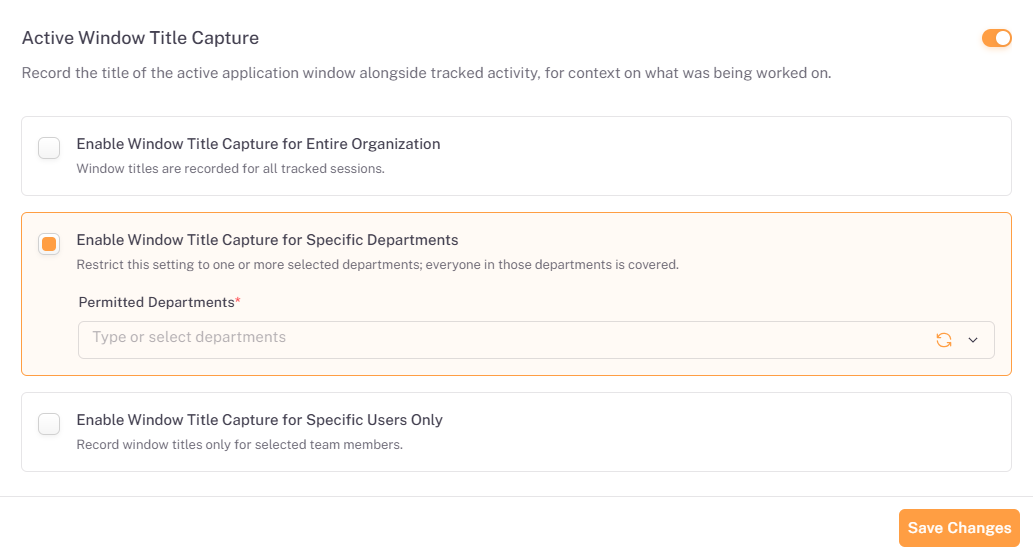
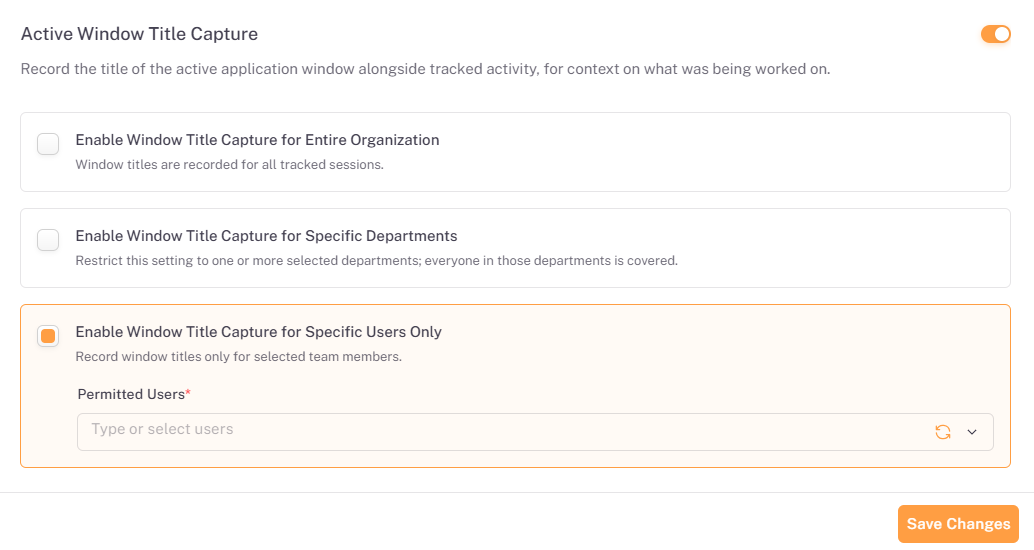
- Select the scope option you need.
- If you chose Specific Departments or Specific Users Only, click the Permitted Departments or Permitted Users field and type or select one or more entries.
- Click Save Changes to apply the setting.
📜 Note: Permitted Departments and Permitted Users are required fields (marked with a red asterisk). Use the refresh icon beside each field to reload the available options.
10.3. Where Window Titles Are Displayed
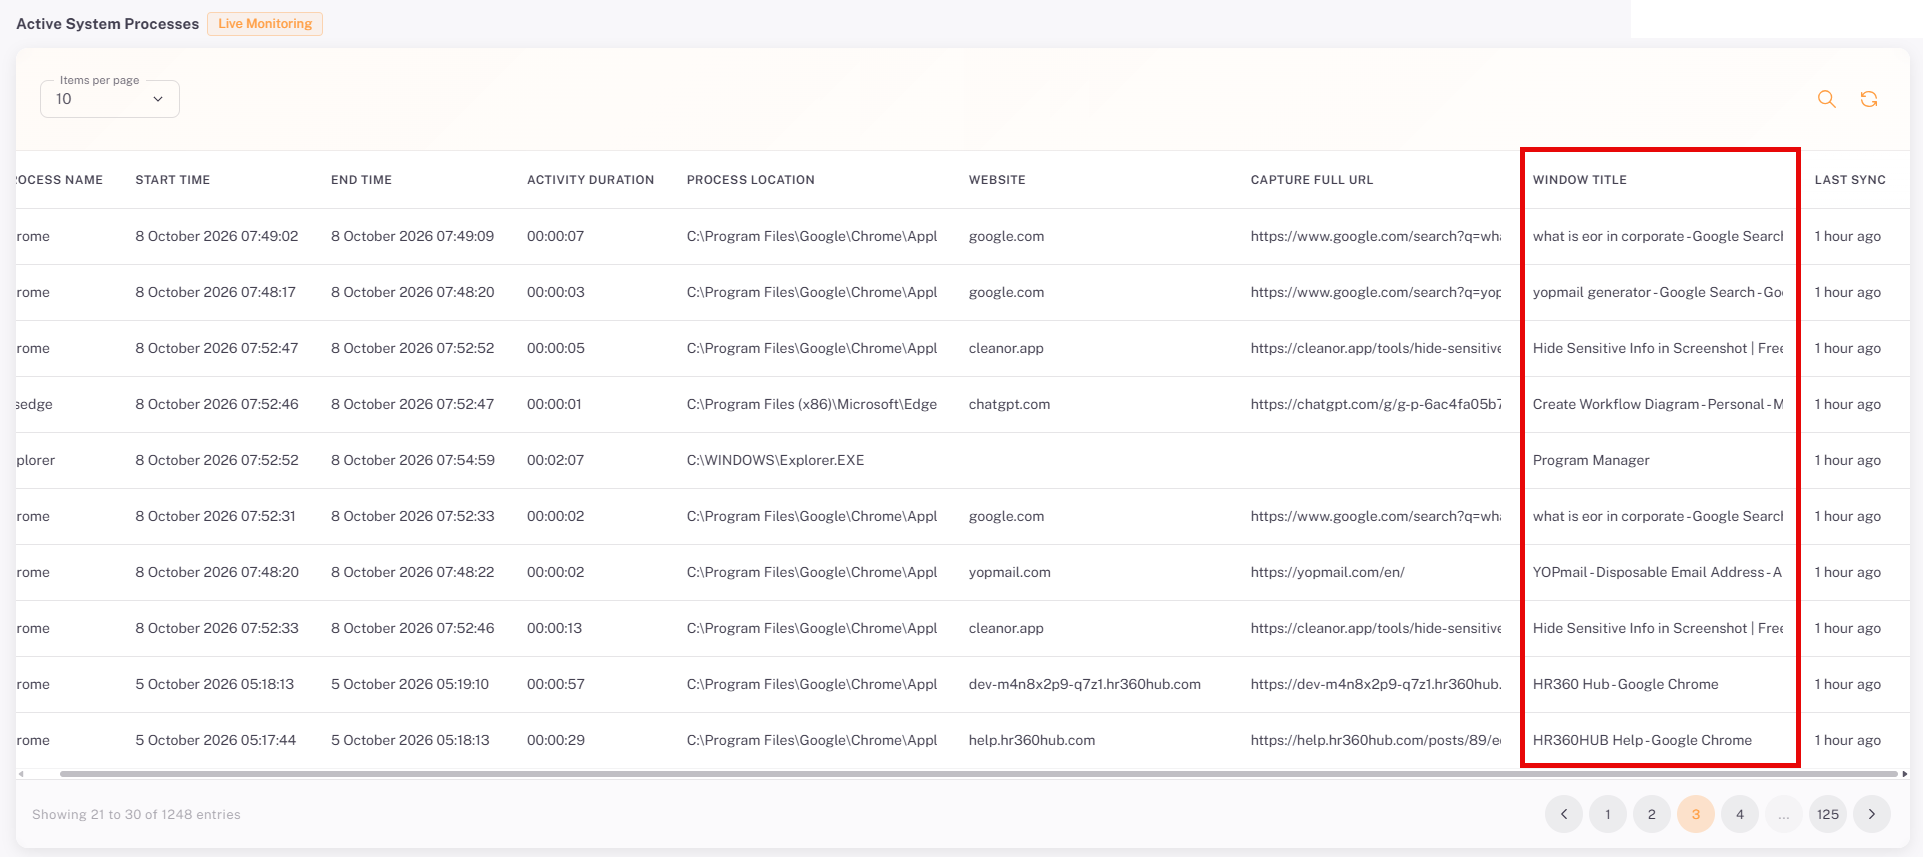
The captured window titles appear in the Window Title column of the Window Title table in Productivity Insights → Live Performance. They also appear in the Active Windows/ Applications list of the screenshot viewer in both Daily Performance and Attendance Screenshots.
10.3.1. Live Performance
10.3.2. Daily Performance & Attendance Screenshots
Section 11:Browser URL Capture Details
The Browser URL Capture Detail page controls how much detail is captured for websites visited during tracking. To open it, click Browser URL Capture Detail in the Desktop App Settings menu.
📜 Note: Browser URL Capture Detail is enabled by default.
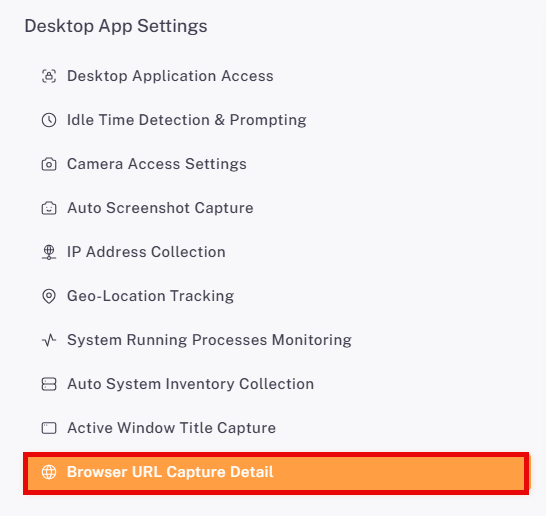
11.1. Enabling Browser URL Capture Detail
Use the toggle in the top-right corner to turn the feature on or off. When it is on, three scope options control whose visited websites are captured in full detail.
Scope Option | Description | Additional Field |
Capture Full URL for Entire Organization | Full page URLs are recorded. Availability may depend on the organization’s subscription package. | None |
Capture Full URL for Specific Departments | Restricts the setting to one or more selected departments; everyone in those departments is covered. | Permitted Departments (required) |
Capture Full URL for Specific Users Only | Full URL capture applies only to selected team members; all others are limited to domain-only capture. | Permitted Users (required) |
11.2. Selecting the Scope
Select the option that matches who the setting should apply to. The selected option is highlighted with a border.
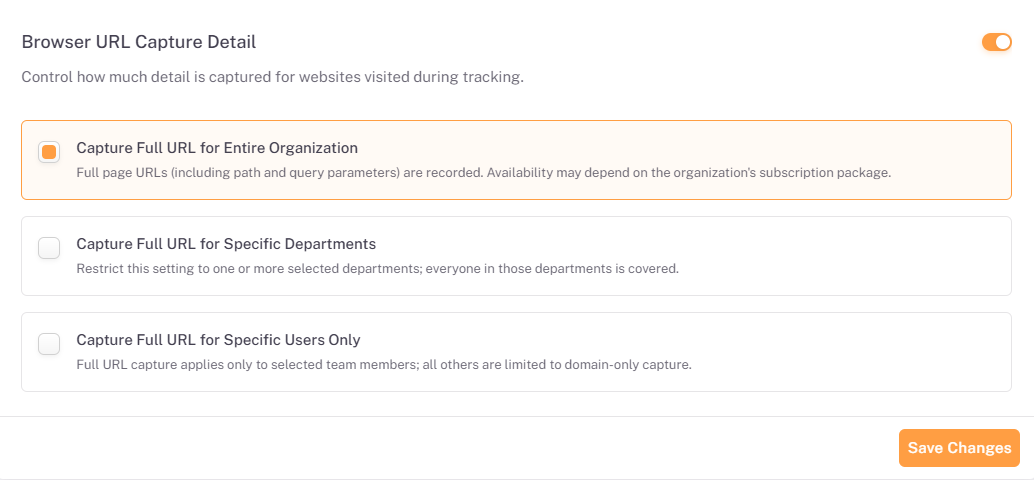
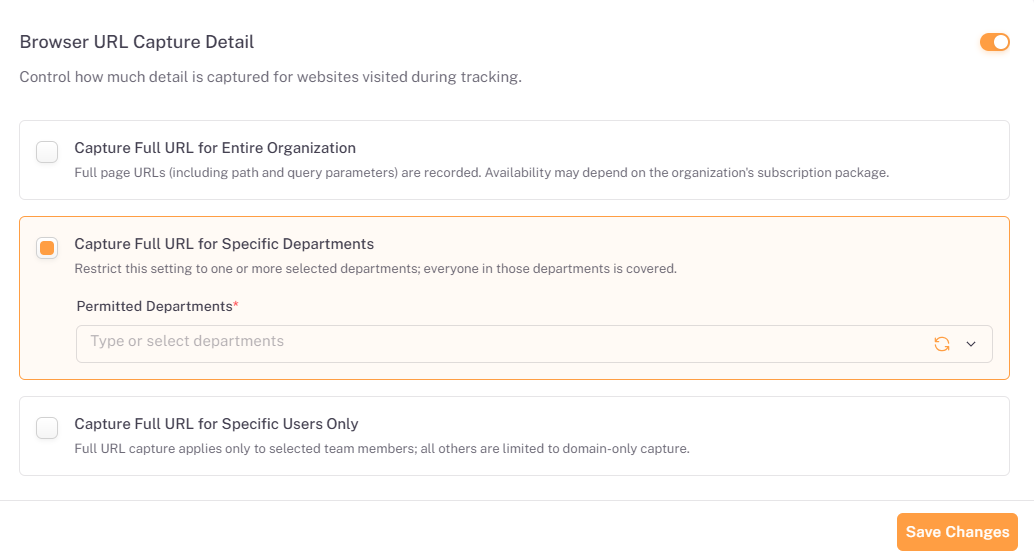
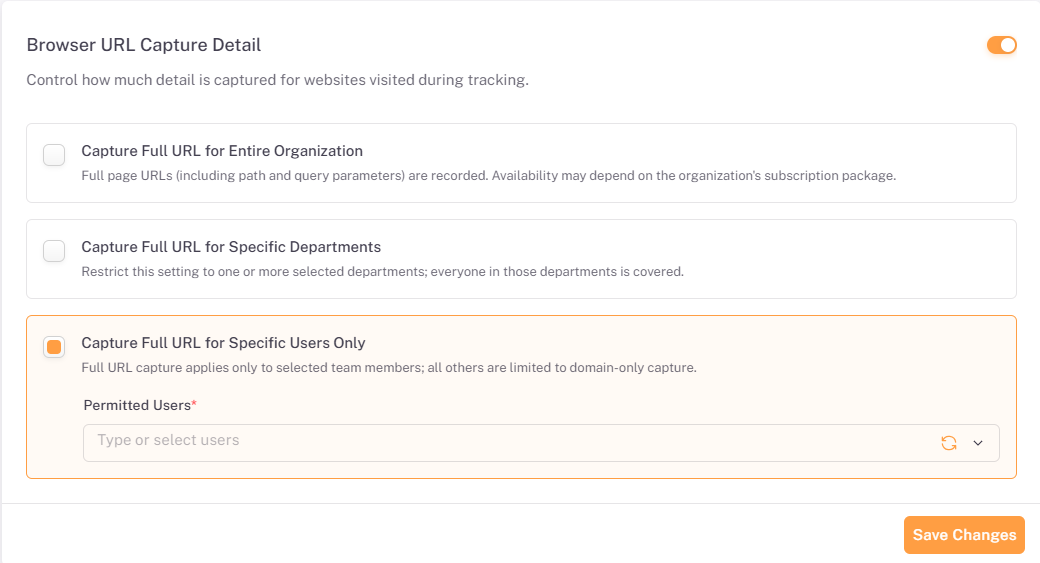
- Select the scope option you need.
- If you chose Specific Departments or Specific Users Only, click the Permitted Departments or Permitted Users field and type or select one or more entries.
- Click Save Changes to apply the setting.
📜 Note: Permitted Departments and Permitted Users are required fields(marked with a red asterisk). Use The refresh icon beside each field to reload the available options.
11.3. Where URLs Are Displayed
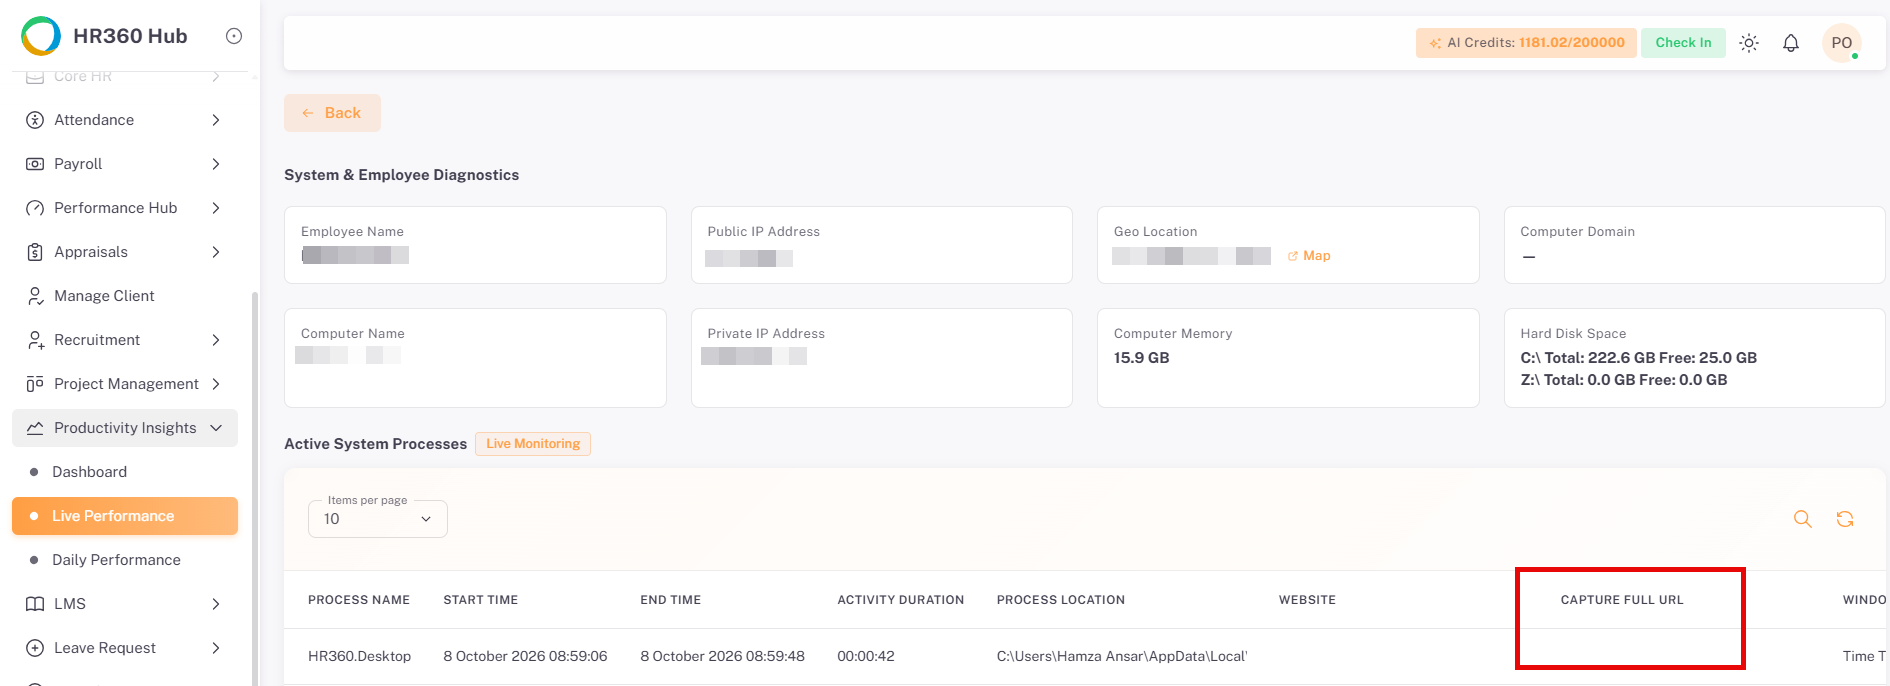
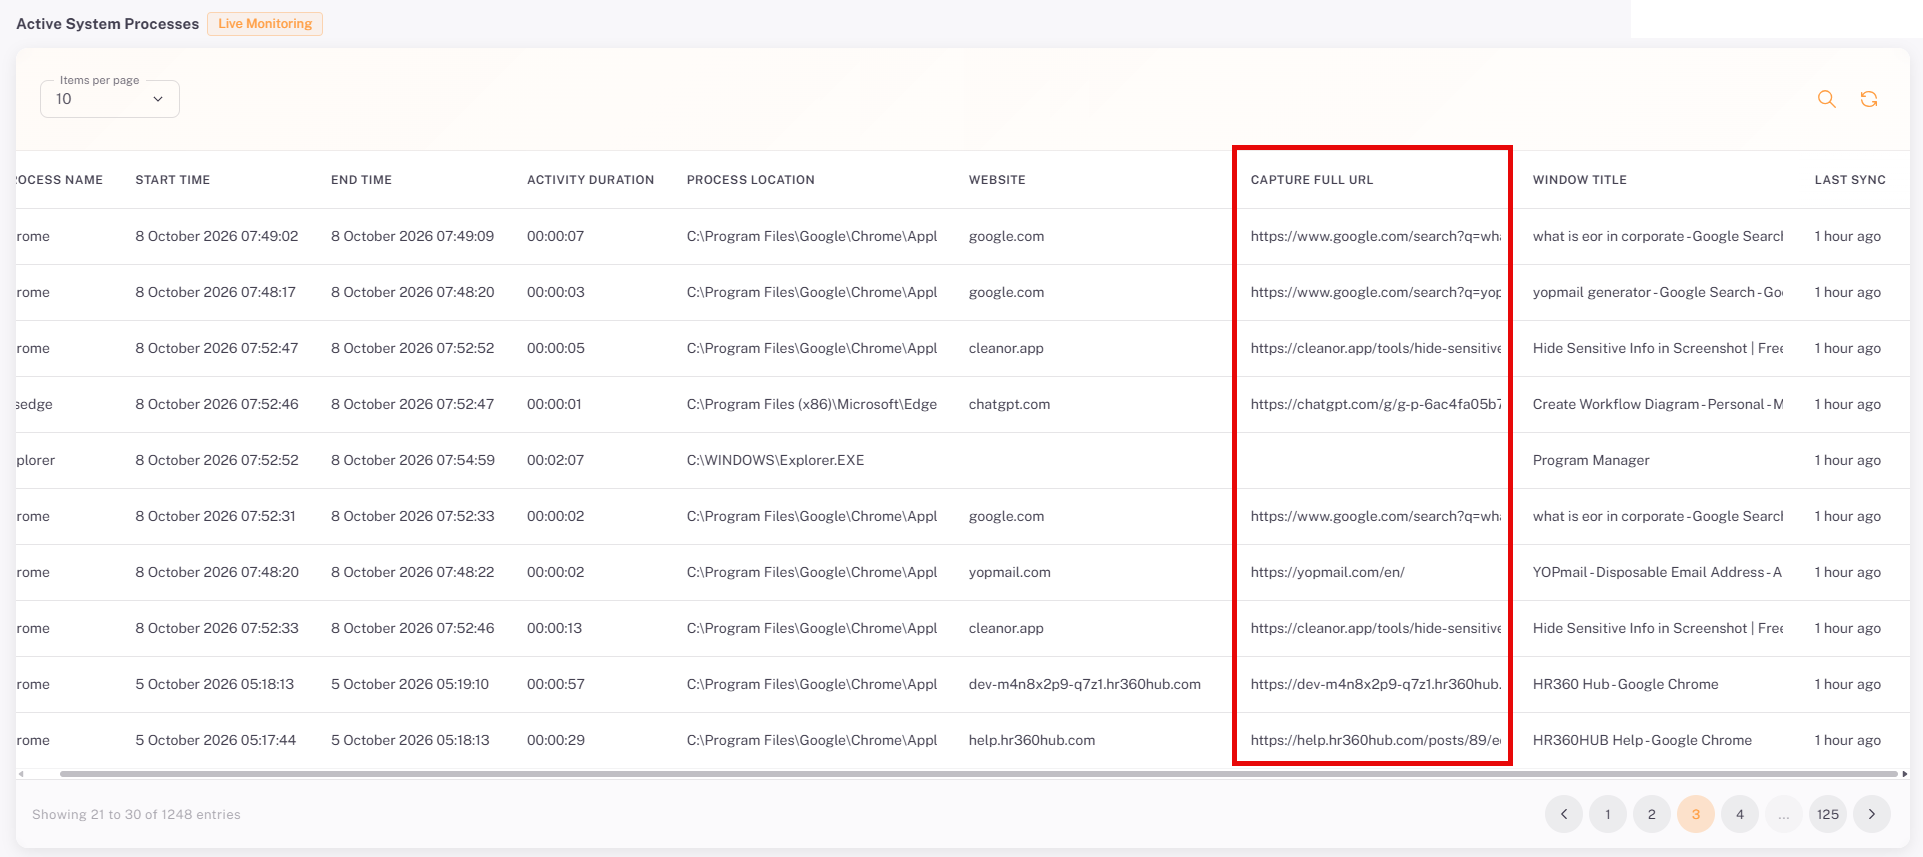
The captured URLs can be seen in Productivity Insights → Live Performance, in the Active System Processes table. The Website column shows the domain, and the Capture Full URL column shows the full page URL for users covered by full URL capture. The column is blank for processes that are not browsers.
Summary
The following table provides a complete step-by-step summary of all key workflows in the Desktop App settings:
# | Action / Step | Result |
1 | Access Desktop App Settings: Log in → Portal Settings in left sidebar → Desktop App. | Desktop App Settings page opens with the sub-page menu on the left. |
2 | Set Desktop Application Access: Desktop Application Access → Turn on the toggle → Select Entire Organization, Specific Departments, or Specific Users Only → Select departments or users if required → Click Save Changes. | Only the selected employees are authorized to log in to the desktop application client. |
3 | Download the applications: Desktop Application Access → Click the download button for Windows, macOS, Linux, or Android. Alternatively: avatar → My Profile → Download Apps → Click the download button. | The installer for the selected platform is downloaded. Downloading from My Profile is not restricted. iOS is displayed but is not currently available. |
4 | Configure Idle Time Detection & Prompting: Idle Time Detection & Prompting → Review or edit the Idle Threshold, Activity Polling Interval, and Inactive After Idle values → Click Save → In Idle Time Prompting Settings, turn on the toggle and select the scope → Click Save Changes. | Idle detection (enabled by default) applies to all desktop app sessions, and users are shown as Idle or Inactive in Live Monitoring after the configured times. Idle prompting applies to the selected scope. |
5 | Enable Camera Access: Camera Access Settings → Turn on the toggle → Tick the compliance confirmation → Click Confirm & Enable → Select the scope → Click Save Changes. | Webcam verification snapshots are enabled for the selected scope. Camera Access is disabled by default and requires confirmation. Camera images are displayed only when Auto Screenshot Capture is also enabled. |
6 | Configure Auto Screenshot Capture: Auto Screenshot Capture → Set the Screenshot Capture Interval and Jitter Window → Select the scope → Click Save Changes. | Desktop screenshots (enabled by default) are captured at randomised intervals for the selected scope. |
7 | View captured screenshots: Attendance → Screenshots → Filter by date range, employee, or project → Click View All for an employee. | Captured screenshots are displayed with capture time, project, task, and activity percentages. |
8 | View screenshots by employee and day: Productivity Insights → Daily Performance → Click the eye icon in the Actions column → Select the date if required. | The employee’s session details and screenshots for the selected date are displayed. |
9 | View camera captures: Open a screenshot from Attendance → Screenshots or Daily Performance → Click Camera at the top of the screenshot viewer. | The camera image captured with the screenshot is displayed. Click Desktop to return to the screen capture. |
10 | Configure IP Address Collection: IP Address Collection → Select the scope → Click Save Changes. | IP addresses (collected by default) are shown in Attendance → Screenshots, Daily Performance, and Live Performance. |
11 | Enable Geo-Location Tracking: Geo-Location Tracking → Turn on the toggle → Tick the compliance confirmation → Click Confirm & Enable → Select the scope → Click Save Changes. | Location is collected for the selected scope. Geo-Location Tracking is disabled by default. Users are prompted for location access and cannot check in to the desktop app if they reject it. |
12 | Configure Process Monitoring: System Running Processes Monitoring → Turn on the toggle → Select the scope → Click Save Changes. | Process data is shown in Live Performance, Daily Performance, and Attendance screenshots. It is captured only when screenshot capture is enabled, and is not shown if the feature is disabled. |
13 | Configure System Inventory Collection: Auto System Inventory Collection → Select the scope → Click Save Changes. | Computer Domain, Computer Name, Computer Memory, and Hard Disk Space (enabled by default) are shown in Live Performance. |
14 | View diagnostics and processes: Productivity Insights → Live Performance → Open the employee’s details. | System & Employee Diagnostics and the Active System Processes table are displayed. |
15 | Configure Active Window Title Capture: Active Window Title Capture → Select the scope → Click Save Changes. | Window titles (captured by default) are shown in Live Performance and in the screenshot viewer. |
16 | Configure Browser URL Capture Detail: Browser URL Capture Detail → Select the scope → Click Save Changes. | URLs (captured by default) are shown in Live Performance; users outside the full-URL scope are limited to domain-only capture. |